By Alessandra Serpes & Christine Vaughan
Grid Interconnection is a Critical Problem
The U.S. power grid is undergoing rapid transformation, with thousands of renewable energy projects awaiting interconnection. However, uncertainty around the cost and timing of interconnection remains a major bottleneck. In a LevelTen Energy industry survey, 90% of developers named interconnection timelines and high costs as the biggest barrier to the Department of Energy’s goal of 40% solar by 2025. “Interconnection is one of, if not the most critical and challenging aspects of generation development and has immense potential to cause projects to fail.” – Enel
Electricity demand is increasing across the U.S. due to factors like electric vehicles, building electrification, and the rise of energy-intensive technologies such as AI and data centers. At the same time, there is growing momentum to meet this demand with clean energy — which has led to a surge in proposed renewable projects, many from small and independent developers. But to deliver power to the grid, these projects must go through the interconnection process, a complex and time-consuming system that can take multiple years to complete.
Currently, there are hundreds of projects waiting in the interconnection queue. Each must undergo a series of technical studies to ensure the grid remains stable and secure if the project is added. These studies determine whether grid upgrades — like transformer expansions or network reinforcements — are needed, and the project developers are expected to pay for these costs. Depending on system conditions, outcomes can range from minor fees to multimillion-dollar upgrade bills.
One of the biggest problems is uncertainty: developers typically have no clear estimate of how much interconnection will cost them until after they’ve already invested significant time and money into the process. This lack of transparency is partially by design — meant to protect critical energy infrastructure information (CEII) and prevent market manipulation. But as a result, many projects ultimately drop out before reaching completion, because the final upgrade costs turn out to be too high. This in turn clogs the system and delays viable clean energy from coming online.
Interconnection Costs are Increasing Due to Higher Network Charges
Berkeley Lab has done an excellent study on interconnection costs, collecting over 2000 samples of interconnection costs over various ISOs and over time. We looked at their data to see if we could glean any additional insights.
Berkely notes that interconnection costs have grown substantially over time. These interconnection costs comprise both point-of-interconnection (POI) costs and network upgrade costs. The POI costs are not a problem. Adjusted for inflation these have been stable and are relatively small. However, the network upgrade costs have sharply risen after Covid. DOE notes that transmission investment peaked in the 2012 to 2015 period and has been declining ever since. This decline in transmission investment is exactly when network interconnection costs increased.
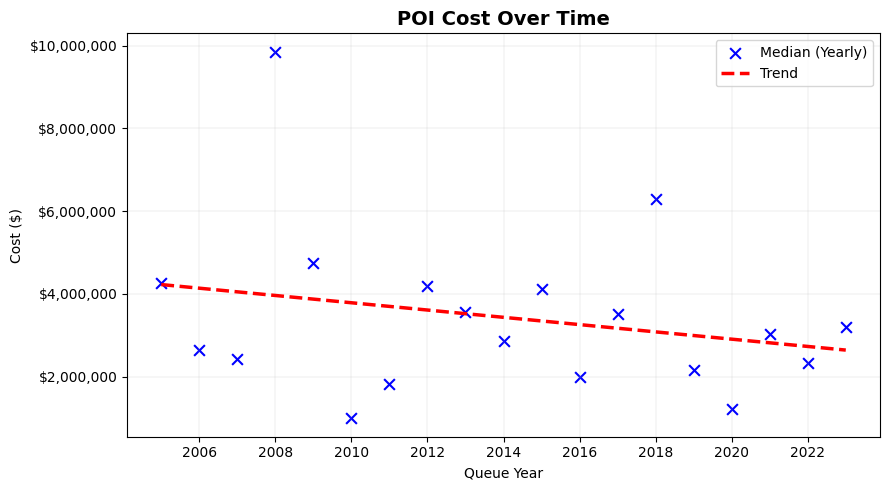
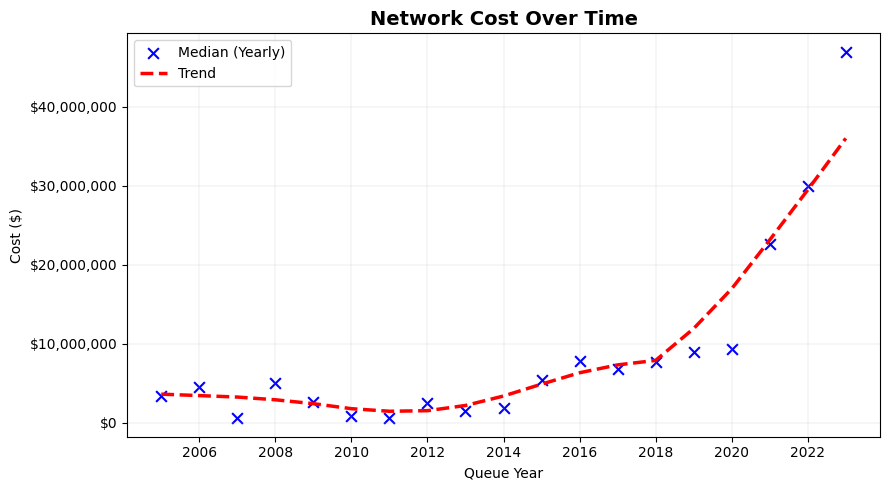
Note: We adjusted costs to 2025 dollars, removed extreme outliers at the 15th and 85th percentiles, and removed data with missing and zero entries.
Different Technologies Face Different Economies of Scale
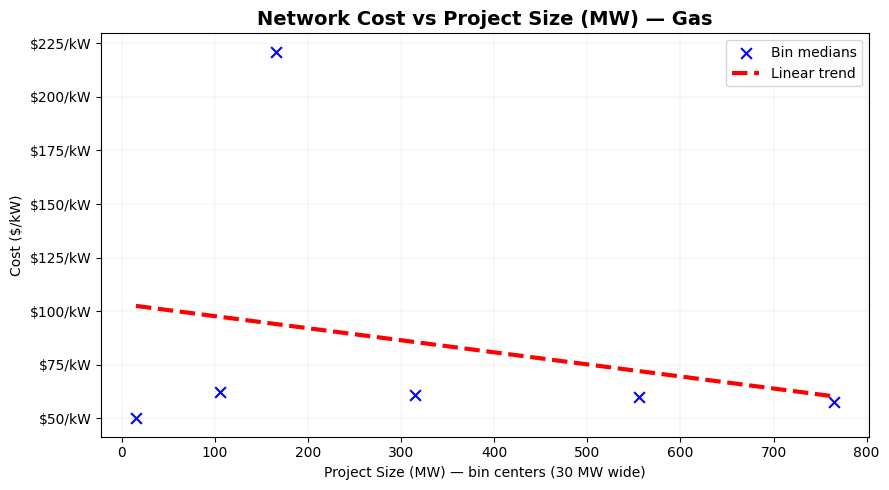
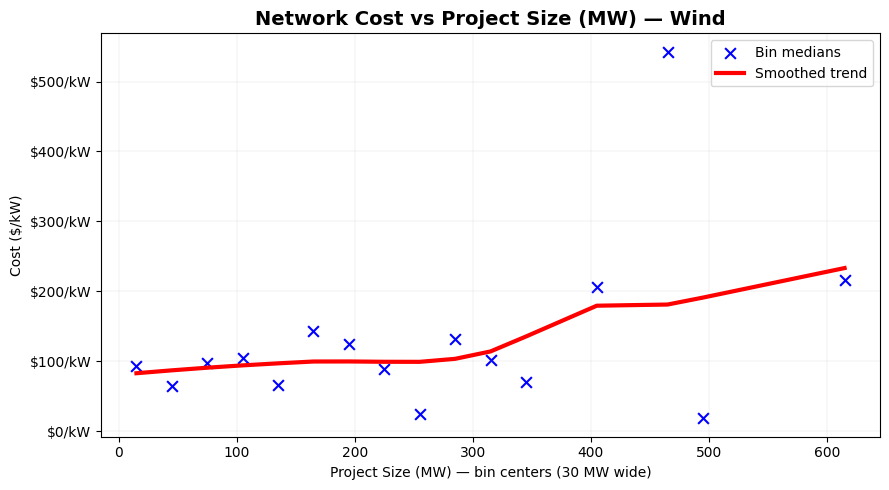
The interconnection costs are presented as a price per kW. But are there economies of scale? Does increasing the project size affect the network upgrade cost perfectly linearly?
There are different network interconnection cost characteristics with each type of generation:
- Gas generation has low network costs and relatively consistent (or slightly improving) with project size.
- Wind generation has moderate costs, but faces higher costs as the project size increases
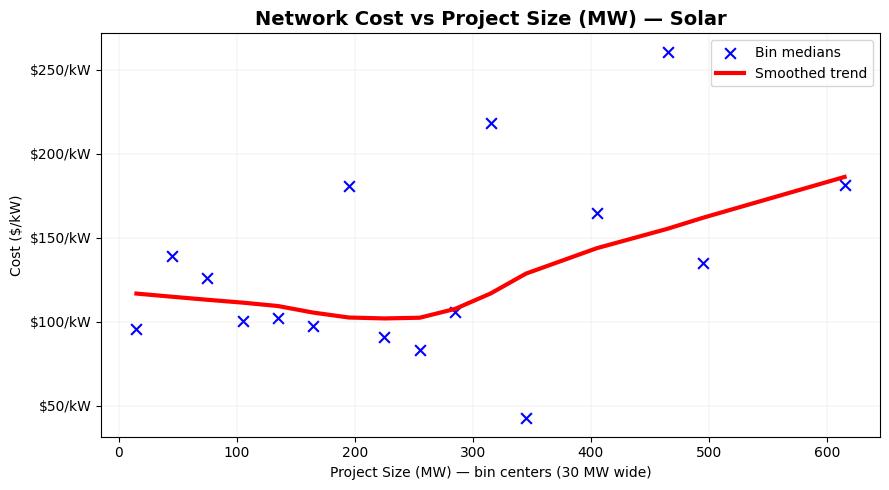
- Solar generation has less discernable trends. It has higher network costs. At larger project sizes the interconnection cost is highly variable and can be quite high.
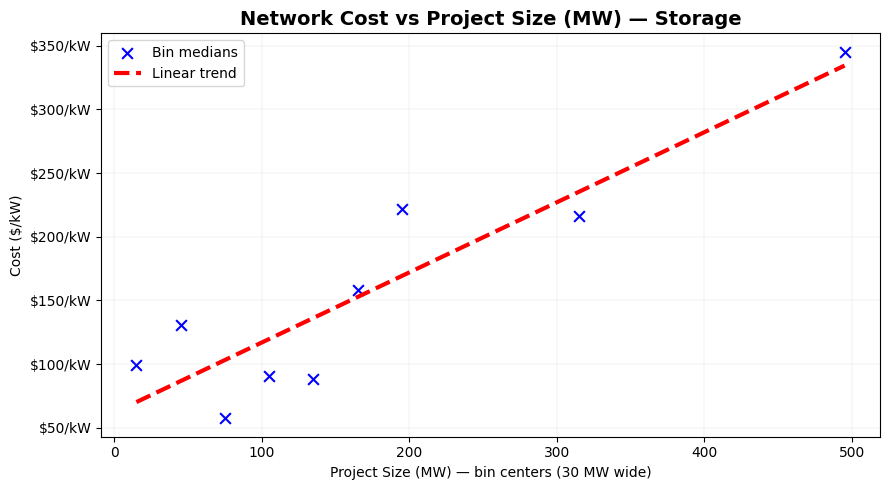
- Storage has high costs that increase with size.
Overall sizes of 200-300 MW appeared to show the optimum size for network interconnection costs.
Different Regoins Face Different Economies of Scale
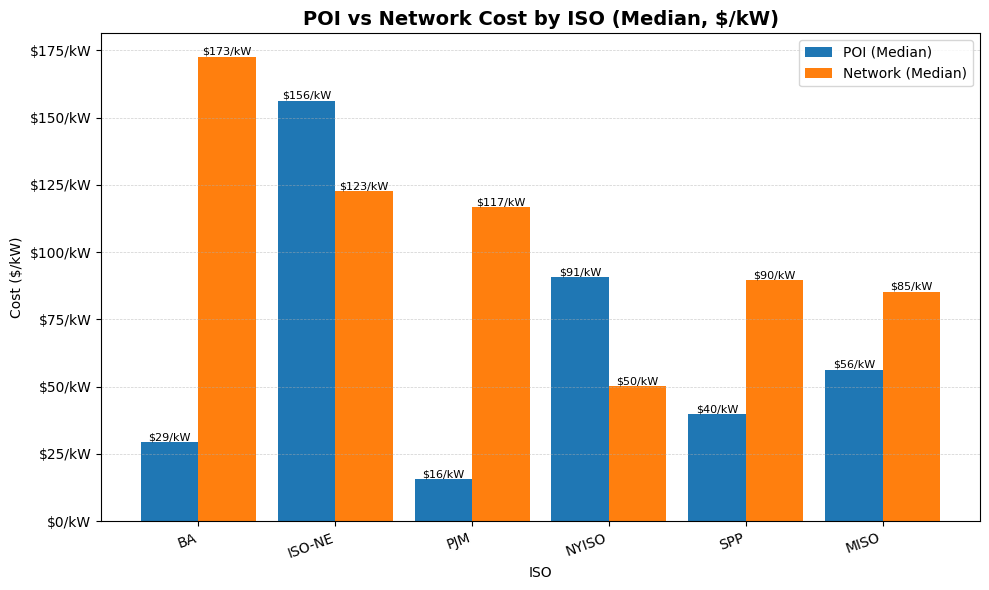
Location matters, with different geographies, energy conditions and rules in each ISO. ISO-NE had the highest point-of-interconnection cost ($156/kW), and the Balancing Authority had the highest median network costs ($173/kW).
Conclusion
With the recent FERC Order 2023, changes are underway that will require cluster studies, more financial commitments, and most visibility of grid availability with hosting maps. While the nation is in the process of changing, the speed of reform is likely going to be too slow. Interconnection issues will remain a key focus in the years to come