
The classroom isn’t the only place where grades have drifted upward. Utility boardrooms graded 2025 bonus targets just as generously. Everything depends on what gets measured and how hard the goals are to achieve. As utilities move toward performance-based regulation to better align incentives with what customers want, the real drivers of behavior lie in the details of these compensation plans. And those details don’t always line up with the priorities of customers.
By the numbers FY2025 annual incentive plans, 52 utilities
137.5%
median utility score against its own target
23%
of individual metrics scored the 200% maximum
64%
of incentive weight on financial metrics
2 of 3
cost-management metrics missed target
The board controls the system for $254 million of executive bonuses
A utility’s compensation committee sets performance targets at the start of the year, then grades the results after the year is complete. The grade, or more specifically the “percent of target” figure, is disclosed for the named executives in the proxy. It is worth keeping in mind how much influence management has in setting that target in the first place, versus the committee, whose job is to push back.
Each metric has a target, and there is usually a threshold level of performance needed to qualify for any incentive at all. Above target, the payout grows, up to a cap. The range is typically 0% to 200% of target, although this varies by utility. The typical plan scores about six metrics, ranging from a single EPS metric at Atmos Energy to 24 metrics and sub-metrics at Pinnacle West. These are weighted together to come up with a final achievement result.
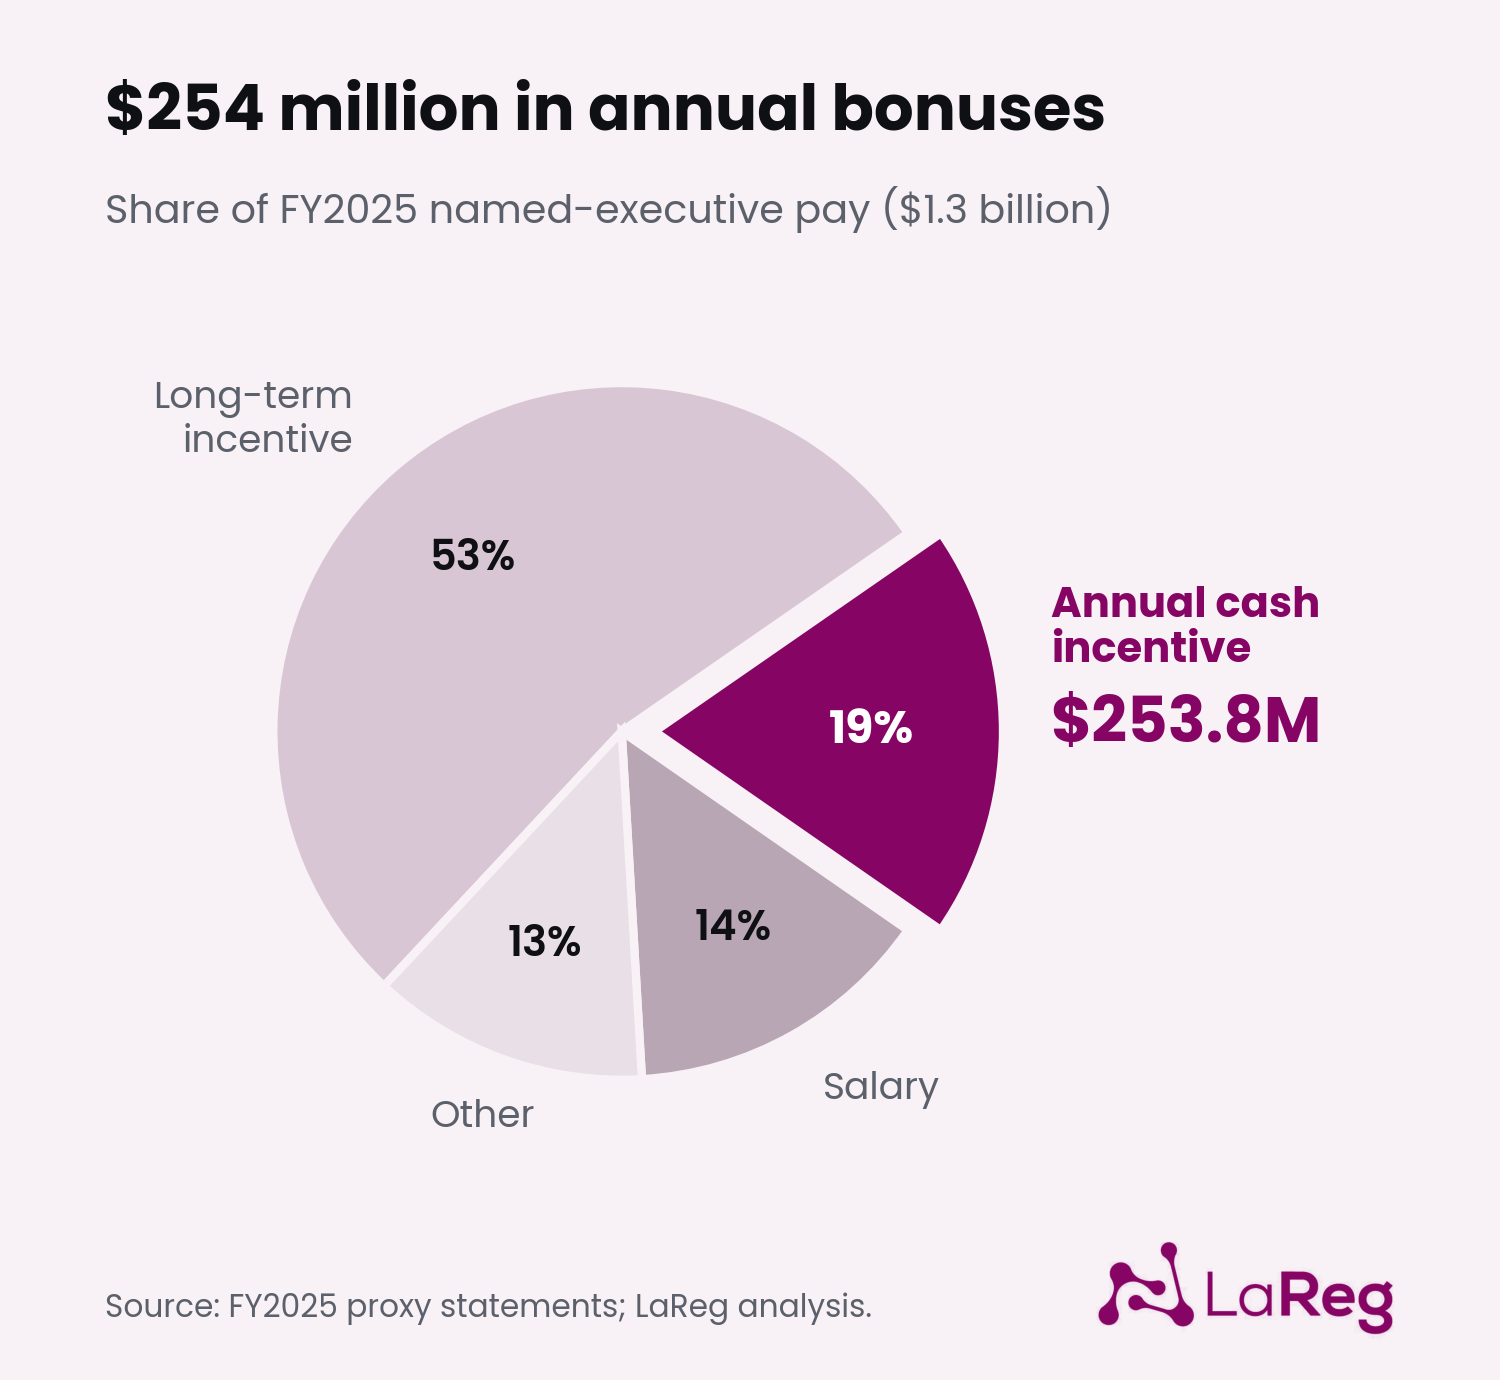
We are talking here about the named executive officers: the CEO, the CFO, and the three other most highly paid executive officers at each utility. For employees below this level, these executives typically decide the size of the bonus pool and how it is divided among the rank and file. Since the named executives set the direction and tone for the whole company, it is useful to see how they are being incentivized and whether they are being pushed to excel.
Named executives collected a combined $253.8 million in these incentives in 2025, across 278 people at 50 companies, roughly $913,000 per executive. That is serious cash. So what are these metrics, and how have companies performed against them?
Almost every company got way more than “target”
Across the sample, the median utility achieved 137.5% of its annual incentive target in 2025. The mean was 136.2%. Only six of the 51 companies (12%) had an overall achievement figure under 100%, meaning they missed their overall targets. (Hawaiian Electric is the 52nd company, and its 2025 incentive was deferred — more on that below.) So just like in schools across the country, nearly every company is getting an A.
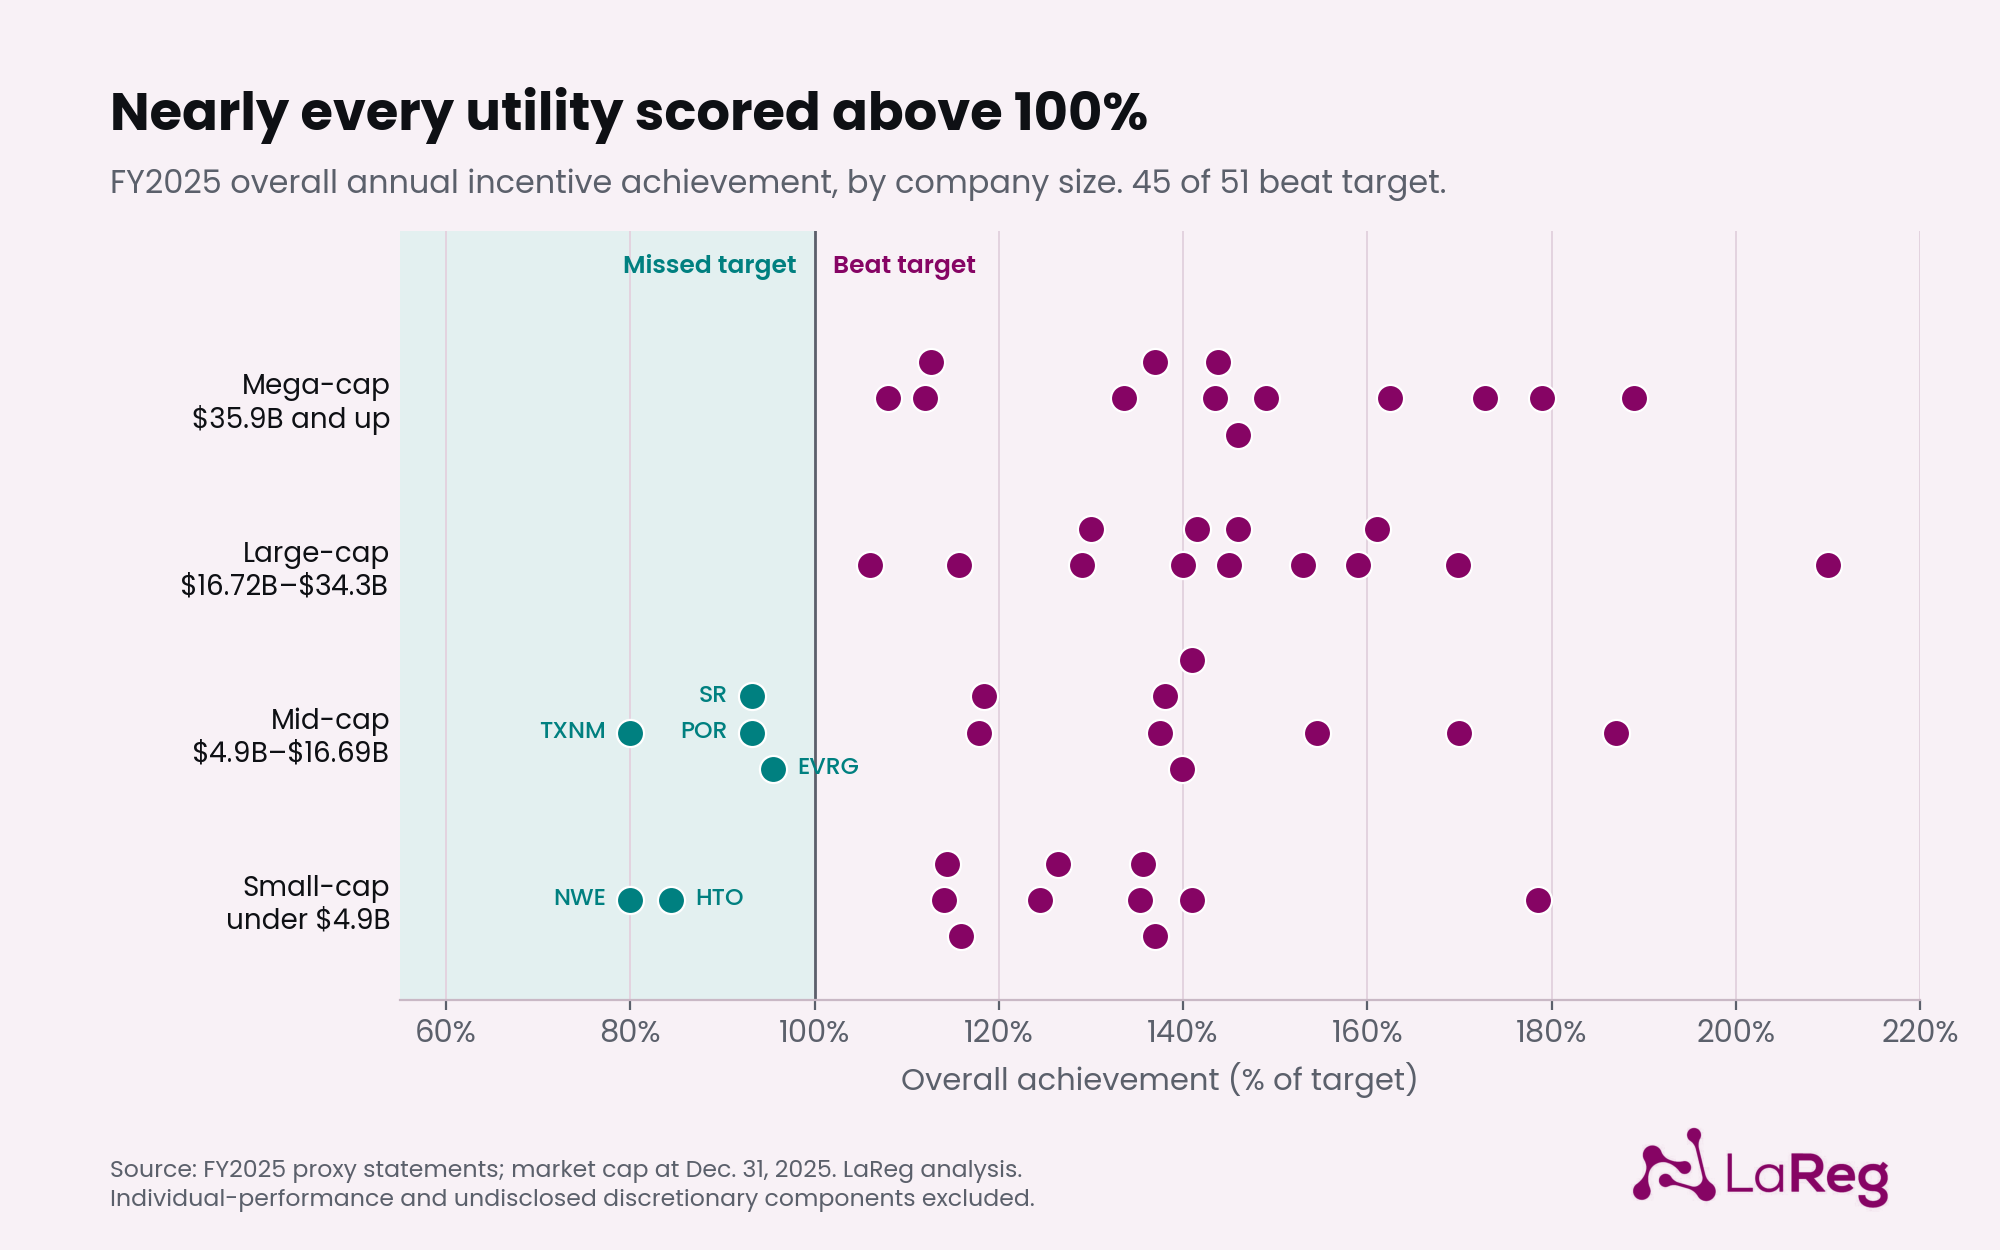
An interesting pattern shows up when the overall achievement results are sorted by company size. Using closing share prices on December 31, 2025, and each company’s own most recently disclosed share count, we split the sample into four groups:
| Size group | Market cap (12/31/2025) | Median achievement |
|---|---|---|
| Mega-cap | $35.9B and up | 143.8% |
| Large-cap | $16.72B–$34.3B | 145.0% |
| Mid-cap | $4.9B–$16.69B | 137.5% |
| Small-cap | Under $4.9B | 125.5% |
Every one of the six companies that missed its target in 2025 is in the bottom half of the sample by market capitalization. Not one of the 26 largest utilities in this sample missed its own target. The relationship is real but modest: company size explains only about 13% of the variation in results (an R² of 0.13, using log market cap). Still, why should size matter at all? Is it due to better performance, or to better executive negotiating power with the Board?
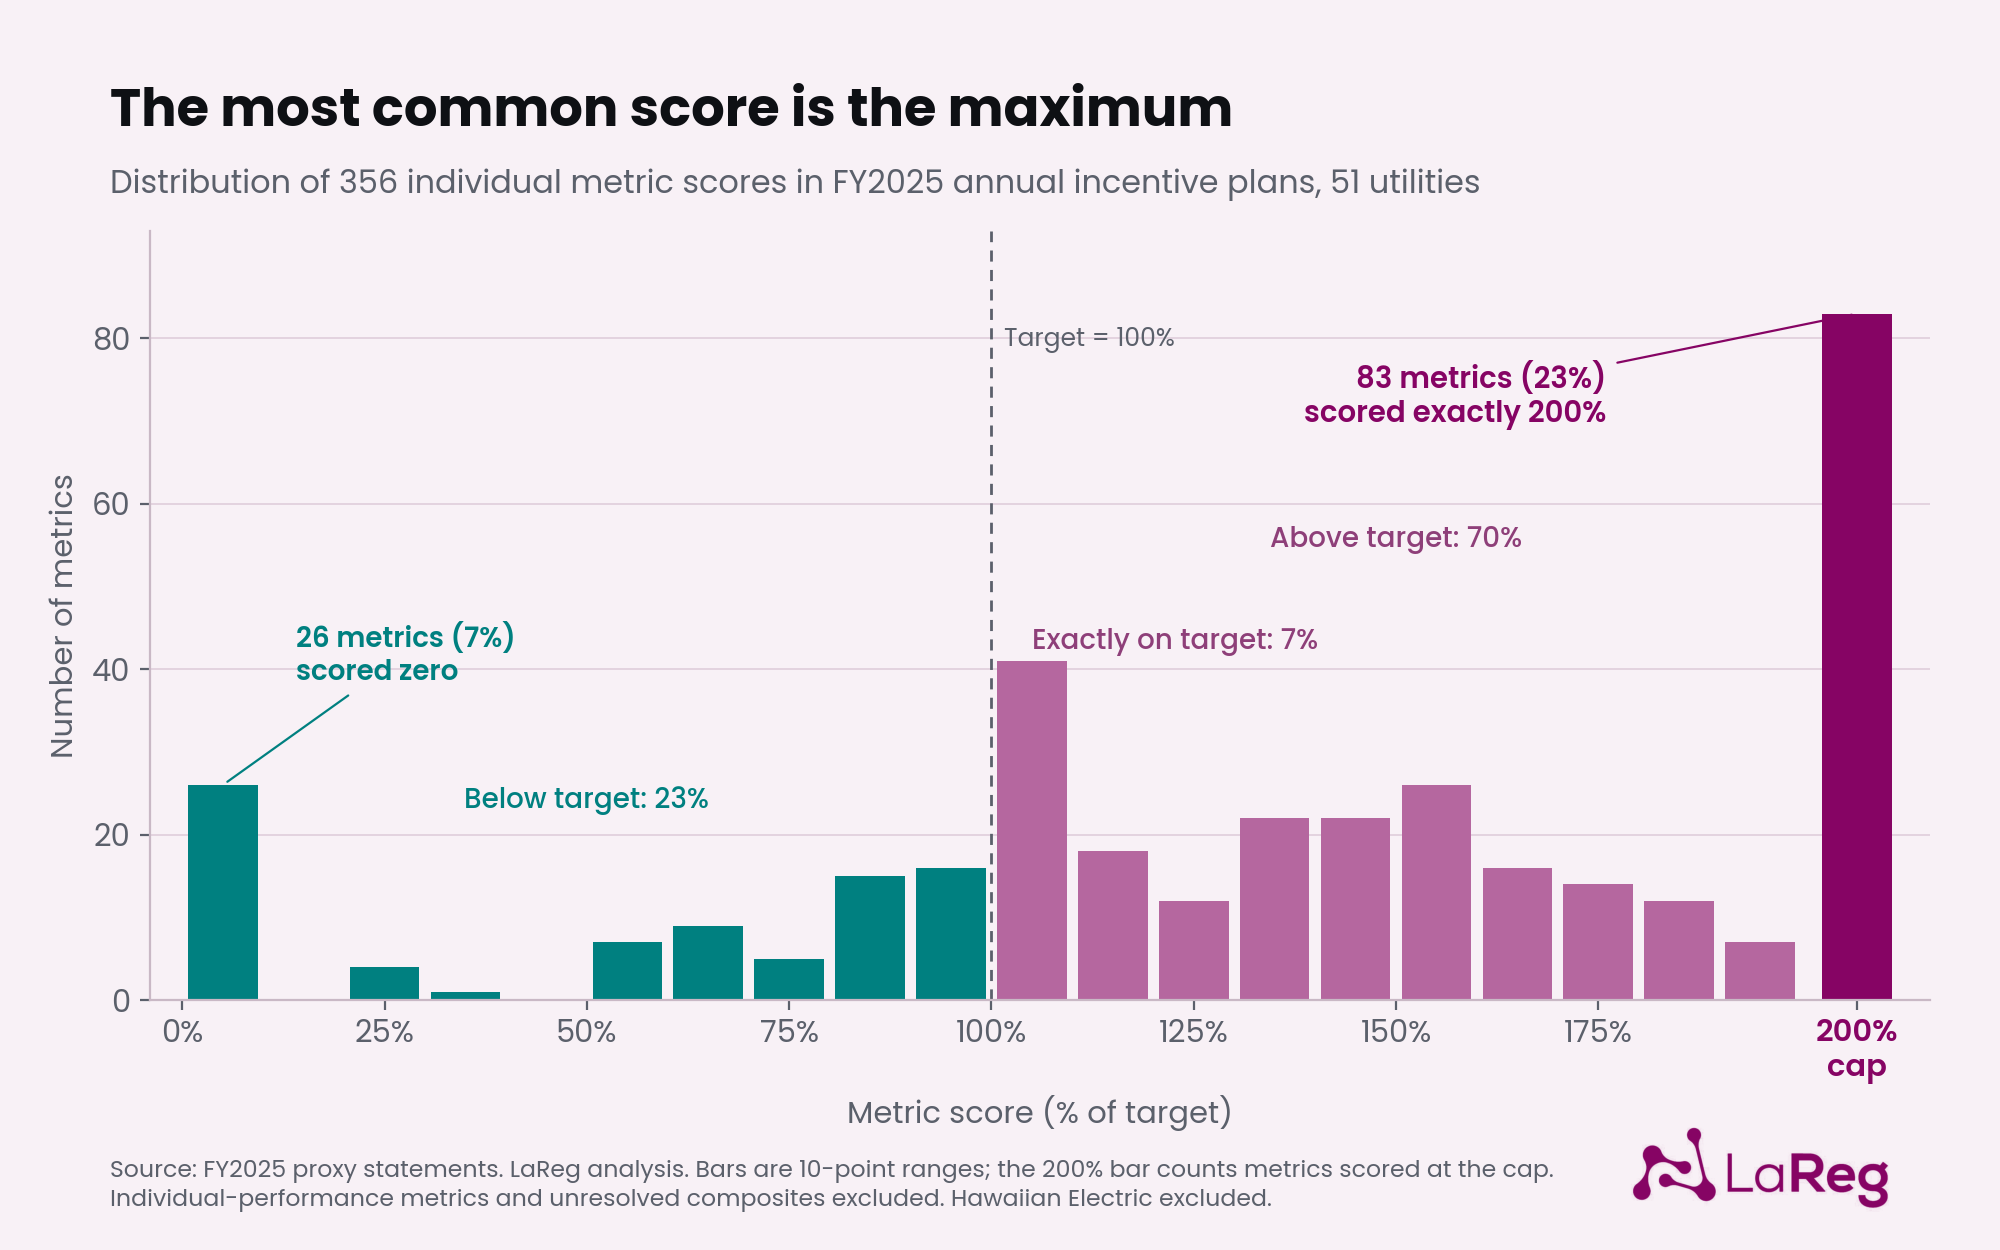
Targets are supposed to be challenging but achievable. Yet if you break down all the metrics and their scores, you notice a huge skew toward the maximum. In fact, the single most common score is the 200% cap: 23% of all scored metrics landed right on it, while only about 7% landed exactly on target.
Financial metrics matter more
Utilities are different from other companies because of their regulated nature. More than other for-profit enterprises, they follow the stakeholder model, answering both to their shareholders and to the public they serve. We looked at every performance metric in this sample to see whether it benefits customers, shareholders, or both.
Utilities disclose a great deal of operational detail in these reports, yet they pay for financial results.
Reliability, safety, regulatory compliance, and cost management land in the win-win box: lower costs and fewer outages serve a ratepayer and an investor at the same time. Earnings per share, other financial metrics, dividend growth, and most sustainability metrics (mostly capacity additions) fall squarely on the shareholder side. Only one category, customer experience, benefits customers without a clear, matching benefit to shareholders. Two categories, workforce and culture measures and the grab-bag of regulatory and strategic initiatives, don’t map cleanly onto either axis.
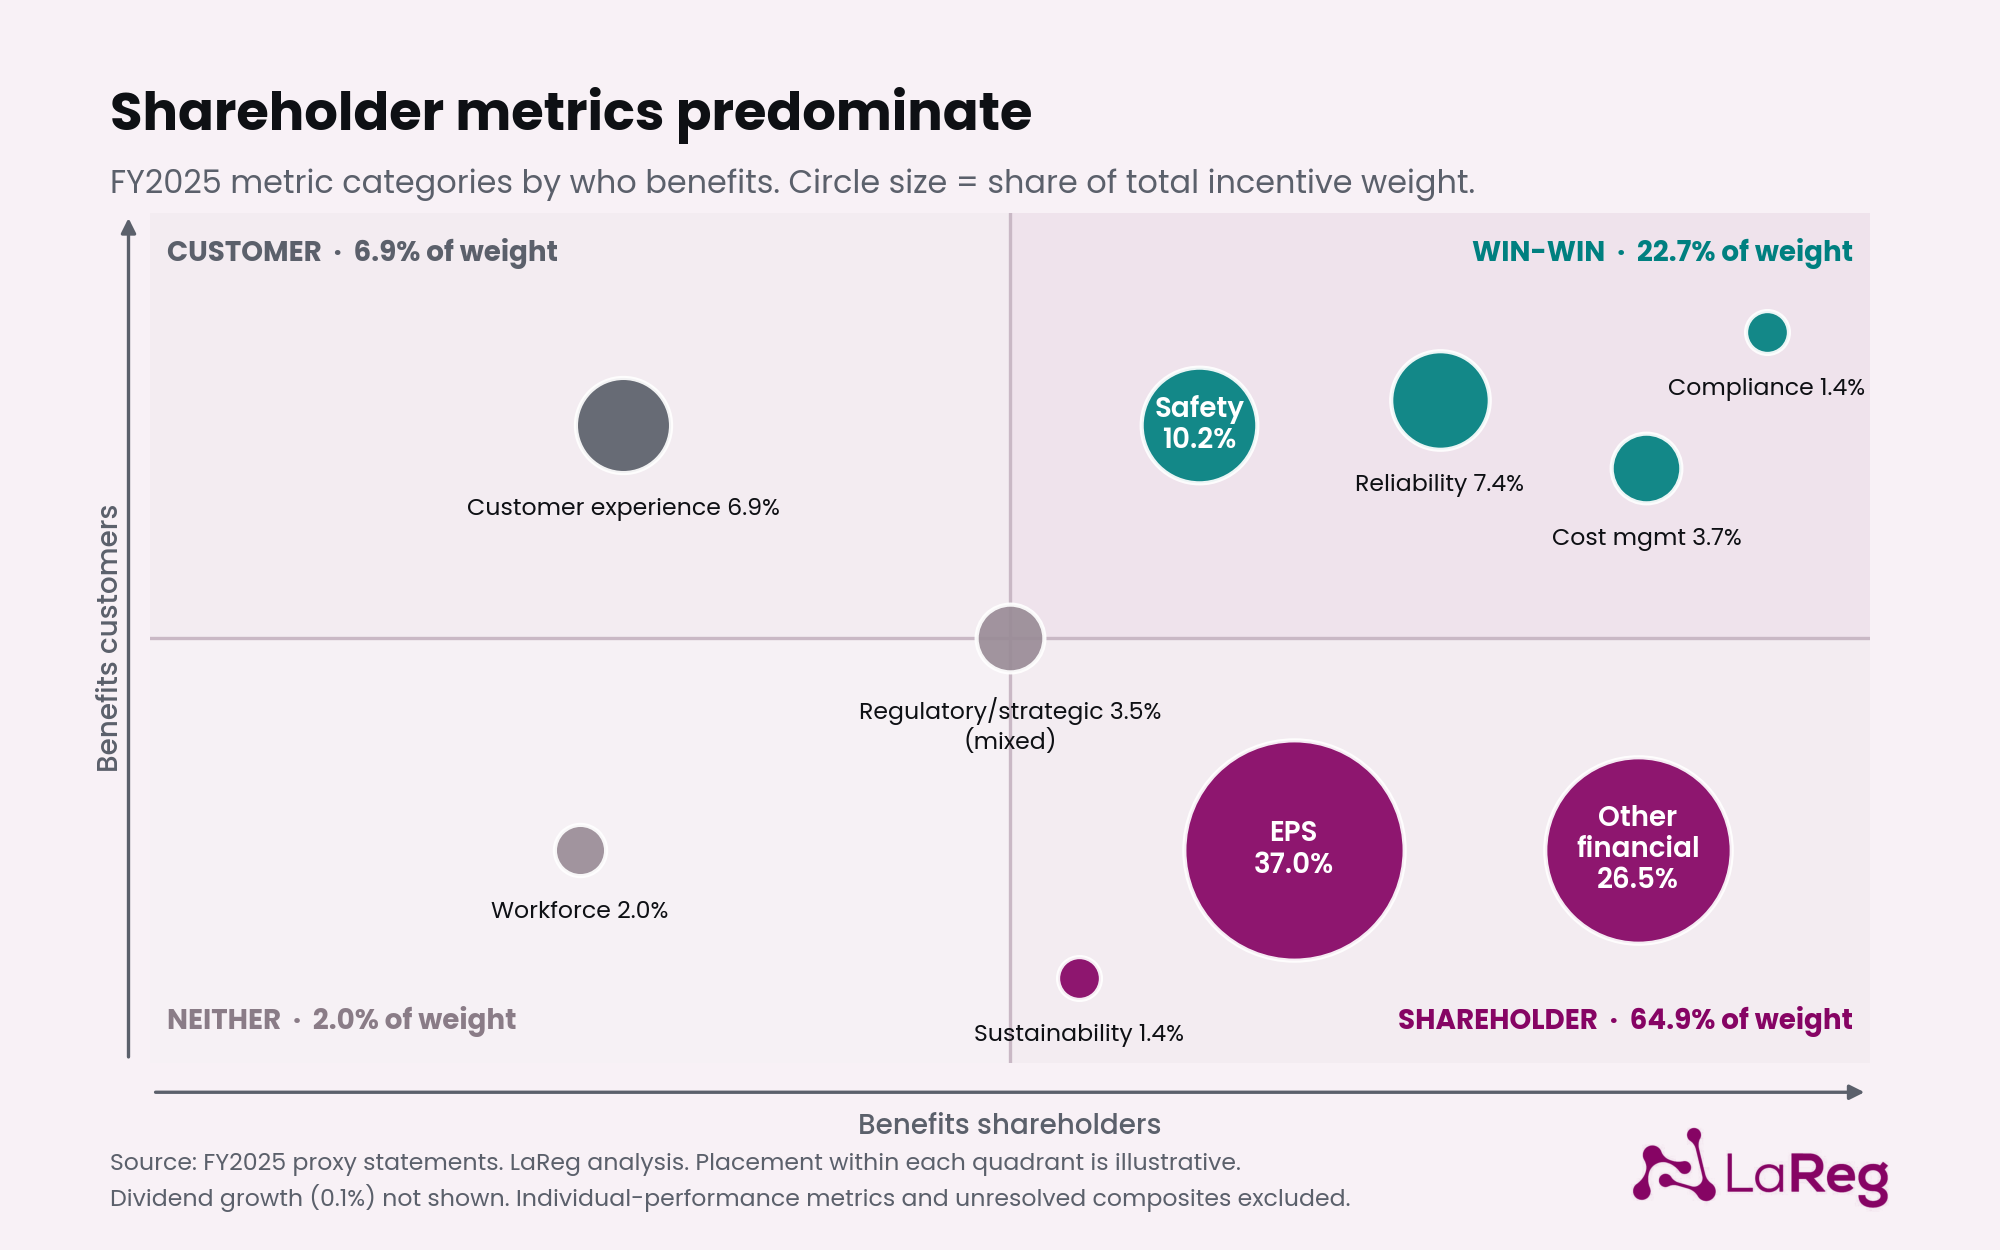
Here is how each category stacks up:
| Category | % of metrics | % of weight | Median achievement | Miss rate | Typical metrics |
|---|---|---|---|---|---|
| EPS | 9.6% | 37.0% | 143.0% | 11.1% | EPS vs. target, often adjusted |
| Other Financial | 10.2% | 26.5% | 144.0% | 18.9% | EBITDA, Net Income, ROE, FCF |
| Safety | 28.1% | 10.2% | 148.7% | 21.4% | OSHA DART/TRIR (relabeled) |
| Reliability | 15.4% | 7.4% | 133.3% | 24.6% | SAIDI, SAIFI, CAIDI, MBI |
| Customer Experience | 14.8% | 6.9% | 124.0% | 34.0% | J.D. Power, internal CSAT/NPS |
| Regulatory / Strategic | 3.4% | 3.5% | 116.0% | 27.3% | Rate case execution, IT projects |
| Workforce / Culture / DEI | 6.2% | 2.0% | 104.0% | 33.3% | Engagement surveys, diversity slate |
| Compliance / Governance | 4.7% | 1.4% | 168.8% | 0.0% | NOV counts, audit findings |
| Sustainability | 4.2% | 1.4% | 163.3% | 6.2% | MW of clean capacity added |
| Cost Management | 3.1% | 3.7% | 90.3% | 66.7% | O&M expense, cost per customer |
Operational categories, especially reliability, safety, and customer experience, make up about four out of five named metrics in the sample. Safety alone accounts for more than a quarter of all metrics. Yet operational metrics carry just over a third of the total incentive weight. Financial metrics, EPS plus “other financial” (mostly EBITDA, net income, and ROE), carry nearly two-thirds. Utilities disclose a great deal of operational detail in these reports, yet they pay for financial results.
EPS is the favored metric
Let’s look at two money-related measures. Companies rarely missed their EPS targets. Across the sample, EPS metrics had a median achievement of 143% and were missed only 11% of the time. Cost Management and Productivity, a category covering things like controlling operating and maintenance expense or holding down cost per customer, had a median achievement of just over 90% and was missed two-thirds of the time. Not one Cost Management metric in the entire sample hit the 200% maximum. It’s the only category in the dataset where the typical result is a miss.
Beating an EPS target means little to the person paying the electric bill.
Cost management is not a popular metric. Only 10 of the 52 companies in this sample carry a standalone Cost Management line item at all. Where it does exist, it typically carries 5% to 30% of the plan, alongside EPS and other financial metrics carrying 35 to 70 points of weight in the same scorecard. Certainly, to make EPS targets a utility must manage costs. But EPS can also be earned by charging customers more.
Beating an EPS target means little to the person paying the electric bill. A dedicated cost-management metric is one of the few things in an incentive plan that translates directly into something a ratepayer would recognize: evidence that management is working to hold down the costs that eventually show up in a rate case.
The metrics rarely point to external standards
One surprising finding was how often companies measure themselves against internal rather than external yardsticks. All companies are trying to improve. But only a handful have metrics that compare performance to external benchmarks, which makes it very hard to compare across companies.
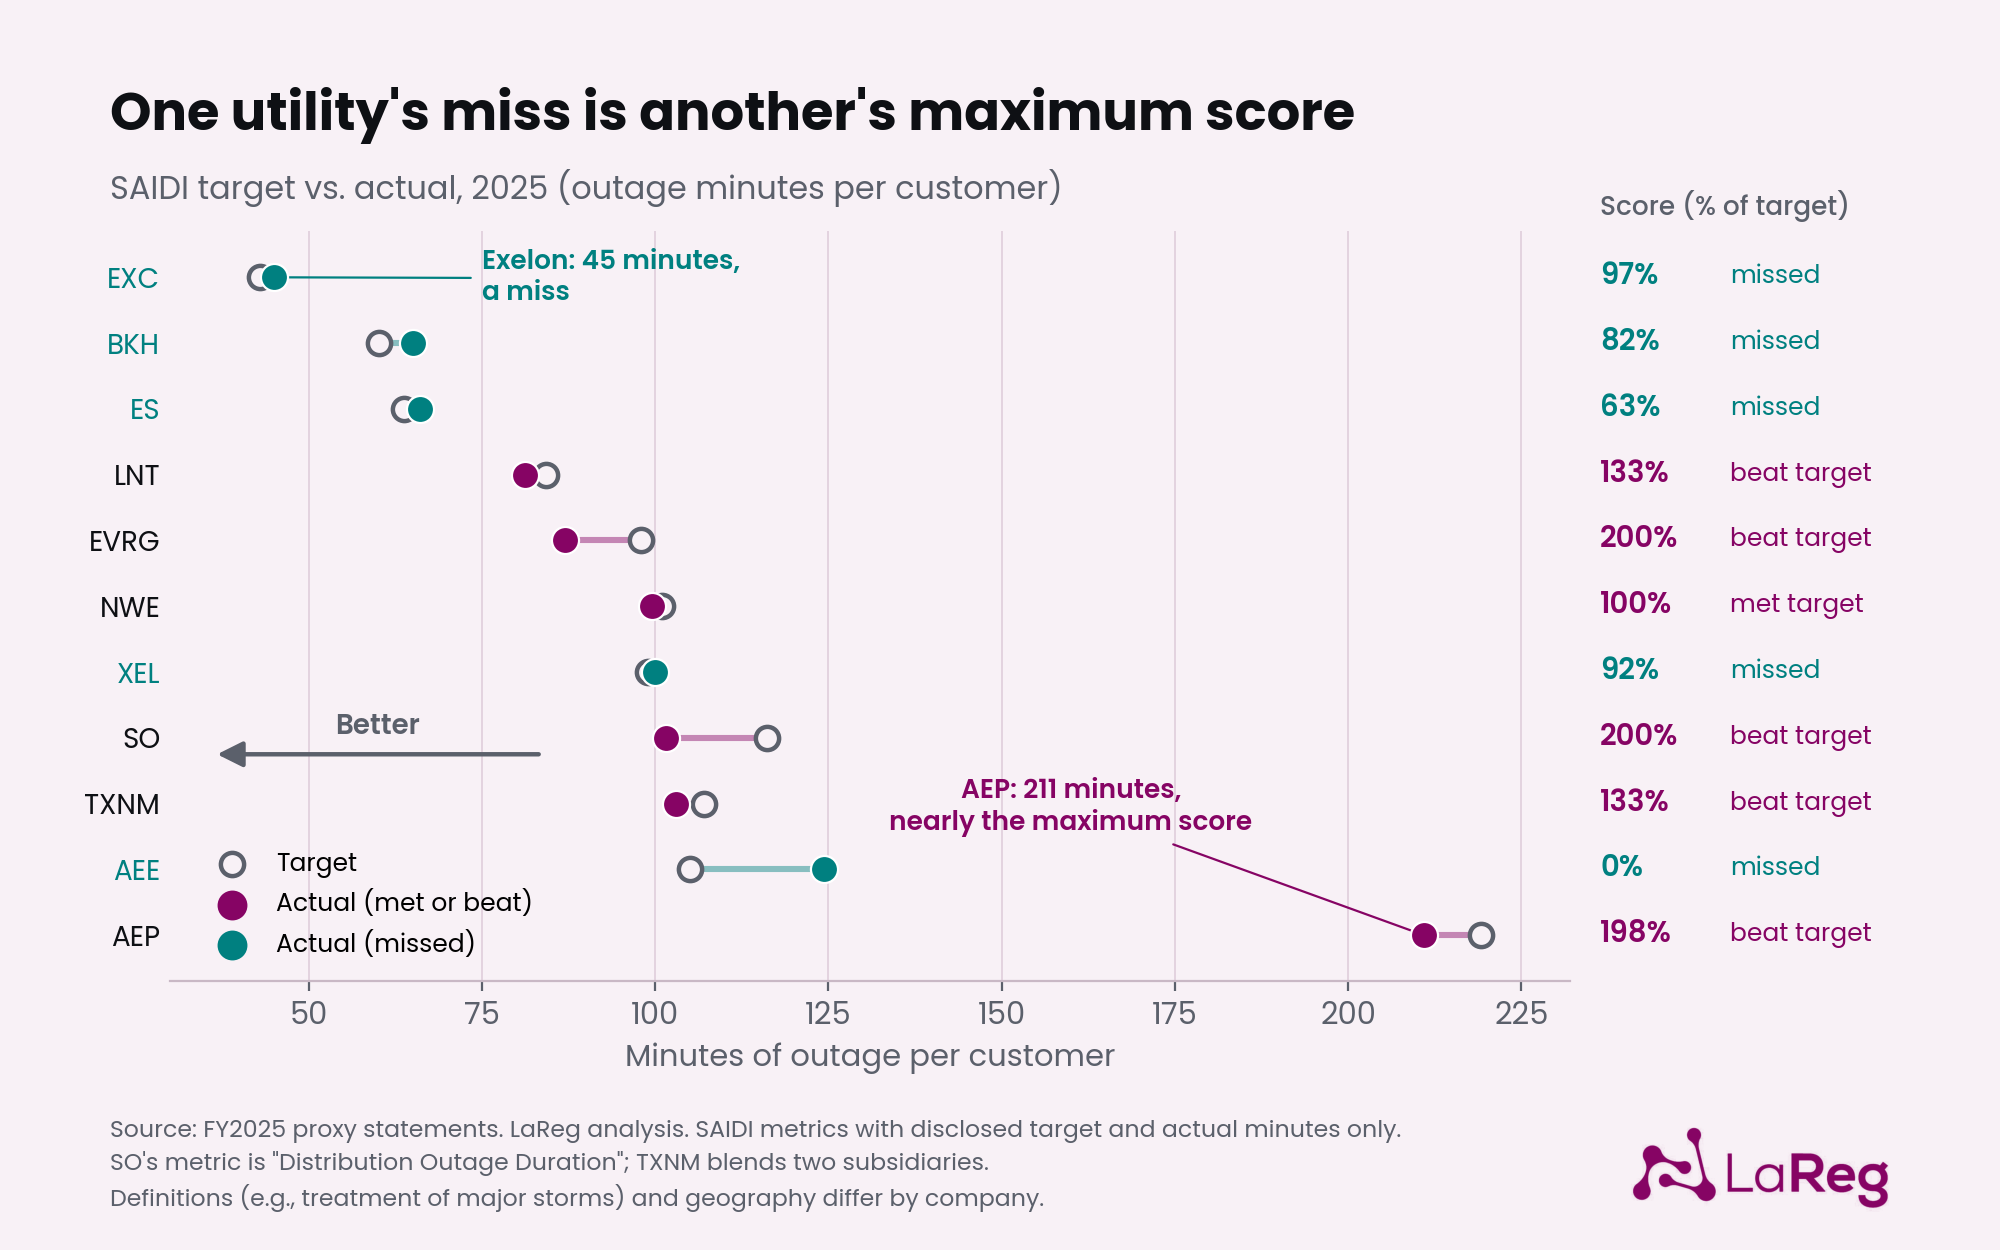
The System Average Interruption Duration Index, or SAIDI, is the clearest illustration, because it’s one of the few metrics in this sample built on an identical, industry-standard formula at every company. Results still ranged from 0% to 200% across 17 instances. Exelon’s 2025 SAIDI target was 43 minutes. American Electric Power’s was 219 minutes, roughly five times looser. Some of that gap is genuine geography: Exelon’s dense urban service territory and AEP’s sprawling, storm-exposed, multi-state footprint don’t face the same physical constraints. But still… really?
Also, compare the gap between a company’s threshold and maximum payout levels, expressed as a share of the target itself, on EPS metrics with clean disclosure. CenterPoint Energy’s entire scoring curve spans one cent on either side of its target: two cents end to end, or 1.1% of the target value. Otter Tail’s spans thirty cents on either side: sixty cents end to end, or more than 10%. An executive at CenterPoint can reach the maximum score with a one-cent beat, barely larger than ordinary quarterly noise. An executive at Otter Tail has to outperform by a real, substantial margin to get the same score. Both companies can report “beat target,” but the two results mean very different things.
Real outside verification is rare across the entire sample. Only 9 of 57 customer-experience metrics, at five companies, use J.D. Power by name, the one benchmark the industry treats as its actual scoreboard. The other 84% are self-designed: internal satisfaction scores, net promoter indices, and complaint counts that sound standardized but answer to no one outside the company that built them. Employee engagement surveys are close to universal corporate practice, yet only 7 of 52 companies tie them to executive pay. Only 3 of 52 tie pay to a standalone cybersecurity metric (and two of those three are phishing tests), a somewhat disturbing fact given the threat profile facing grid and water infrastructure. Sustainability metrics overwhelmingly reward building new clean-generation capacity or infrastructure, not reducing emissions: only 3 of 52 companies measure an actual reduction in anything.
The handful of metrics anchored to something outside the company (SAIDI and SAIFI’s standardized formulas, J.D. Power where it’s actually used, and OSHA’s federally defined safety categories) are the closest things to a national standard in this dataset. Everything self-designed is personal-best territory. One real exception exists, discussed further down.
Moving the goalposts
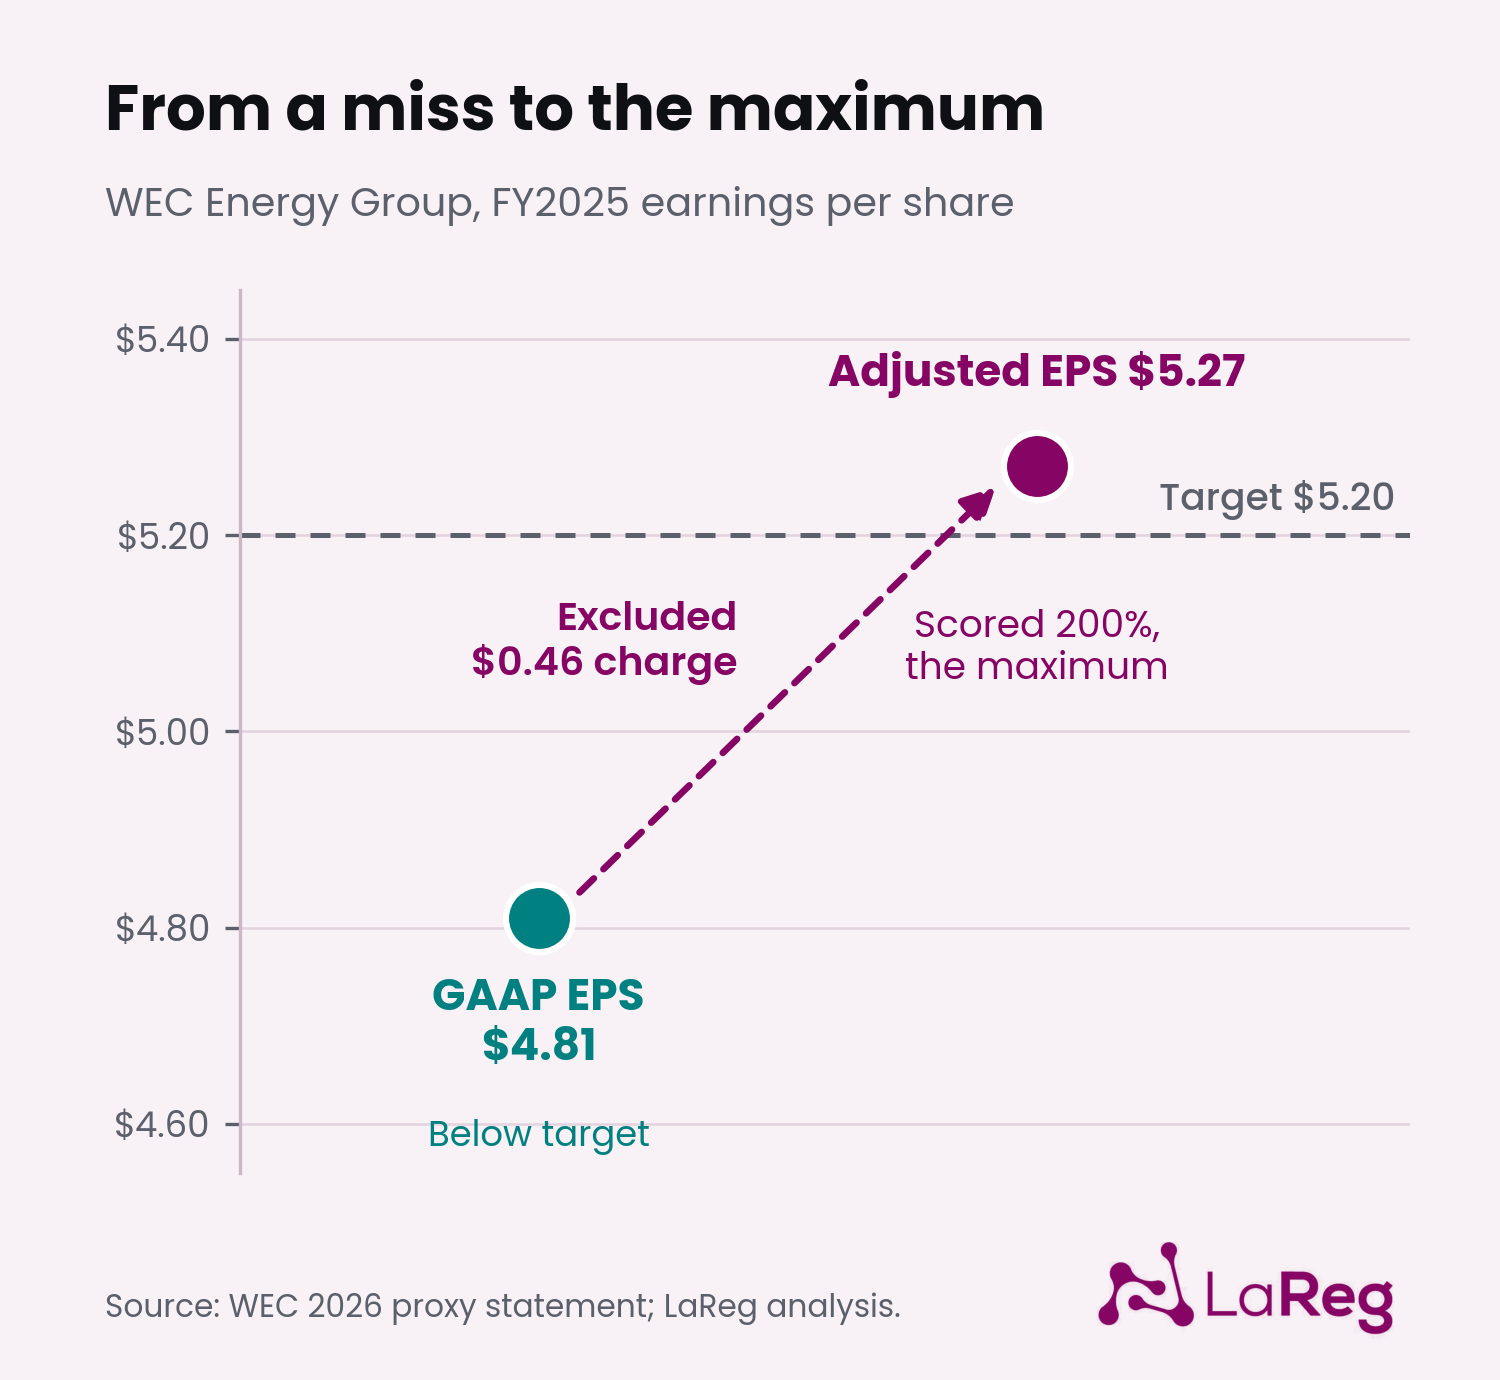
Sometimes executives appear to collect bonuses even when they don’t produce the results. The sharpest example in this sample belongs to WEC Energy Group. WEC’s GAAP earnings per share for 2025 came in at $4.81, below its $5.20 target, because accounting rules required the company to book a $0.46-per-share charge tied to a proposed, not-yet-approved Illinois rider settlement. The compensation committee determined the charge “is not indicative of WEC Energy Group’s operating performance,” producing an adjusted EPS of $5.27, above target, which scored the full 200% maximum. WEC’s overall result, 210% of target, was the highest in the sample. One discretionary exclusion turned a miss into a maximum score, on a charge the company’s own accountants had booked.
Adjustments like this are common, and they don’t always favor executives. Avista and Unitil adjusted their EPS results up; Atmos and Pinnacle West adjusted theirs down; and some committees decided no adjustment was needed. So the evidence is mixed on whether these adjustments help or hurt executives.
At times the calculations are unclear or complicated. For instance, Southern Company disclosed the weights of its individual operational metrics in 2022, 2023 and 2024. In 2025, the weights disappeared. That same year, the gas damage ratio metric scored only 22% of target, but with no weight disclosed, readers can’t tell how much it counted. It’s hard to determine whether the goalposts changed, but the disclosure certainly did.
Compensation committees with teeth
None of this means boards never hold the line. For example, after a workplace fatality in November 2025, PPL’s compensation committee retroactively created a new safety sub-metric inside its incentive plan, scored it at zero, and cut every named executive’s individual-performance factor as a direct result, from 165% to 120%. The company didn’t have a standing safety metric built for this. The committee built one after the fact, specifically so the fatality would show up in the number. Edison International’s committee also acted after the formula was done: the plan scored 140% for 2025, but the committee cut the CEO’s actual award by roughly 40% because of the 2025 wildfire impact.
Hawaiian Electric’s 2026 proxy lays out a conventional, fully weighted scoring table for its CEO: 35% adjusted net income, 35% utility operations, 30% strategic value creation. None of it determined the actual 2025 payout. Neither the holding company CEO nor the utility CEO received a 2025 incentive; their compensation was converted to a deferred structure tied to Maui wildfire litigation settlements, payable in installments through 2029. The published scorecard and the real outcome diverged completely, a useful reminder that a compensation committee’s discretion extends further than any published formula suggests.
Some plans also include standing “modifiers” that can reduce incentives after a safety or public incident. Dominion’s plan works this way: its safety, customer experience, reliability, and compliance results can only lower the EPS-funded payout, never raise it, and in 2025 they trimmed it from 115% to 108%. Designs like this may become more popular.
The California exception on compensation design
Nearly everything in this dataset is self-designed and self-graded. California is the exception.
Under AB 1054, the 2019 state law passed in the aftermath of the wildfires that drove PG&E into bankruptcy, any California electrical utility seeking a wildfire safety certification must have its executive incentive compensation structure approved by the state’s Office of Energy Infrastructure Safety. The statute says the structure may tie up to 100% of incentive pay to safety performance and may deny all incentive compensation if the utility causes a catastrophic wildfire that results in one or more fatalities. The review is not a rubber stamp: in 2021, the state’s wildfire safety regulator rejected the executive compensation structure submitted by Bear Valley Electric Service. Three companies in this sample own California electric utilities subject to this requirement: Edison International (Southern California Edison), Sempra (San Diego Gas & Electric), and American States Water (Bear Valley Electric Service).
This is the one place in the entire dataset where an outside party, a state safety regulator rather than the company’s own board, reviews and signs off on the link between pay and safety performance. The review focuses on how the plan is built, not on how hard each year’s targets are; Edison International and Sempra still scored 140% and 173% on their 2025 formulas. But every other example here, including Edison International’s own wildfire-driven pay cut above, happens inside a closed room with no outside check. California’s process is a glimpse of what the rest of the industry’s self-graded plans might look like with an outside check.
Where this goes next
The utilities in this sample didn’t fail their own tests, because most of them wrote tests that are difficult to fail. EPS rarely misses. Compliance and governance metrics did not miss once across 14 scored instances. Cost Management is the one category that behaves like a genuine target, and it’s the one category boards measure least. The median utility scored 137.5% of target. The “grades” really are mostly A’s, and the boards handing them out approved the exam.
On the question of investors versus customers, the weights tell the story: nearly two-thirds of the incentive weight goes to financial metrics that mainly serve shareholders.
The “grades” really are mostly A’s, and the boards handing them out approved the exam.
The stronger programs point to external measures and yardsticks, while the weaker ones measure improvement against their own past results.
And with the growing push toward affordability and performance-based ratemaking, there may be more impetus to align incentives with customer-centered goals, similar to California’s approach.
Methodology
This analysis covers 52 investor-owned utility holding companies, drawn from FY2025 proxy statements filed with the SEC (Form 10-K/A for Enbridge), covering the annual cash incentive plan only, not long-term equity awards.
Data collection and a first verification pass were done by AI; a complete second pass, line by line against the primary filings, was done by hand. Discrepancies between the two were resolved by returning to the source filing, including several cases where the relevant table existed only as a chart image and had to be read directly from the rendered page. AI was used for image generation and also used for grammar and spelling checks of the write-up.
Assumptions:
Where a company’s plan includes an individual-performance modifier layered on top of its formulaic score, or a slice of the plan left to committee discretion with no disclosed score, that component is excluded from the achievement figures used for cross-company comparison here, and the remaining metrics are rescaled to 100%. For example, American States Water’s eight scored metrics make up 80% of its plan; rescaled, they produce 114.4%. The company-disclosed total, which counts the discretionary 20% as zero, is 91.5%.
Where a filing bundles several distinct themes into one undifferentiated number, usually because the detail exists only as an unreadable chart, that result is logged as an “unresolved” composite rather than forced into a single category. Twelve such rows exist in the underlying dataset and are excluded from the category table above. In that table, miss rate is the share of scored metrics that came in below 100% of target, and one dividend-growth metric is not shown.
Market capitalization figures use the closing share price on December 31, 2025, and each company’s own most recently disclosed share count from its SEC filings. Both figures are dated and sourced individually, company by company.
Hawaiian Electric and Ameren required special handling. Hawaiian Electric’s 2025 incentive payout was never calculated from its published scoring formula; it’s excluded from every achievement-based statistic here and discussed on its own terms above. Its metrics do count toward the metric and weight shares in the category table, since those describe plan design. Ameren’s disclosed CEO payout includes an undisclosed individual modifier; the figure used here is the formulaic result calculated from its disclosed, weighted metrics before that modifier is applied.
Reference table
Ticker, company, FY2025 overall achievement, and source filing for all 52 companies in the sample. Page numbers refer to the annual cash incentive discussion within each proxy.
| Ticker | Company | Achievement | Source | Page(s) |
|---|---|---|---|---|
| AEE | Ameren Corp | 161.1% | Ameren Corporation 2026 Proxy Statement | 59-64 |
| AEP | American Electric Power Co Inc | 162.5% | AEP 2026 Proxy Statement | 53 |
| AES | AES Corp | 138.0% | AES Corporation 2026 Proxy Statement | 49-50 |
| ATO | Atmos Energy Corp | 153.0% | Atmos Energy 2026 Proxy Statement | 38-40 |
| AVA | Avista Corp | 114.0% | Avista Corporation 2026 Proxy Statement | 41-43 |
| AWK | American Water Works Company Inc | 141.5% | American Water Works 2026 Proxy Statement | 36-38 |
| AWR | American States Water Co | 114.4%* | American States Water Company 2026 Proxy Statement | 57-58 |
| BKH | Black Hills Corp | 118.4% | Black Hills Corporation 2026 Proxy Statement | 27-29 |
| CEG | Constellation Energy Corp | 112.7% | Constellation Energy 2026 Proxy Statement | 59-62 |
| CMS | CMS Energy Corp | 129.0% | CMS Energy 2026 Proxy Statement | 30-32 |
| CNP | CenterPoint Energy Inc | 159.0% | CenterPoint Energy 2026 Proxy Statement | 47-50 |
| CWT | California Water Service Group | 141.0% | California Water Service Group 2026 Proxy Statement | 59-65 |
| D | Dominion Energy Inc | 108.0% | Dominion Energy 2026 Proxy Statement | 44-46 |
| DTE | DTE Energy Co | 169.9% | DTE Energy 2026 Proxy Statement | 42 |
| DUK | Duke Energy Corp | 112.0%* | Duke Energy 2026 Proxy Statement | 50-54 |
| ED | Consolidated Edison Inc | 143.5% | Consolidated Edison 2026 Proxy Statement | 55-59 |
| EIX | Edison International | 140.0% | Edison International 2026 Proxy Statement | 43-54 |
| ENB | Enbridge Inc | 146.0%* | Enbridge Inc Form 10-K/A (Amendment No. 1) | 34-36 |
| ES | Eversource Energy | 145.0% | Eversource Energy 2026 Proxy Statement | 47-48 |
| ETR | Entergy Corp | 149.0% | Entergy Corp 2026 Proxy Statement | 55-60 |
| EVRG | Evergy Inc | 95.5% | Evergy 2026 Proxy Statement | 40-41 |
| EXC | Exelon Corp | 133.6% | Exelon 2026 Proxy Statement | 45-47 |
| FE | FirstEnergy Corp | 106.0% | FirstEnergy 2026 Proxy Statement | 45-49 |
| HE | Hawaiian Electric Industries Inc | n/a (deferred) | HEI 2026 Proxy Statement | 32; B-1 (Exhibit B) |
| HTO | H2O America (formerly SJW Group) | 84.4% | H2O America 2026 Proxy Statement | 40-43 |
| IDA | IDACORP Inc | 170.0% | IDACORP 2026 Proxy Statement | 33-35 |
| LNT | Alliant Energy Corp | 130.0% | Alliant Energy 2026 Proxy Statement | 24-26 |
| MDU | MDU Resources Group Inc | 126.4% | MDU Resources 2026 Proxy Statement | 54-56 |
| MGEE | MGE Energy Inc | 135.3% | MGE Energy 2026 Proxy Statement | 33-35 |
| NEE | NextEra Energy Inc | 189.0% | NextEra Energy 2026 Proxy Statement | 52-59 |
| NFG | National Fuel Gas Co | 137.5% | National Fuel Gas 2026 Proxy Statement (FY ends Sept 30) | 47-52 |
| NI | NiSource Inc | 146.0% | NiSource 2026 Proxy Statement | 37-39 |
| NJR | New Jersey Resources Corp | 115.9%* | New Jersey Resources 2025 Proxy Statement (FY ends Sept 30) | 47-55 |
| NWE | NorthWestern Energy Group, Inc. | 80.0% | NorthWestern Energy 2026 Proxy Statement | 41-44 |
| NWN | Northwest Natural Holding Co | 135.6% | NW Natural Holding 2026 Proxy Statement | 24, 31-35 |
| OGE | OGE Energy Corp. | 117.9% | OGE Energy 2026 Proxy Statement | 32-36 |
| OGS | ONE Gas, Inc. | 124.5% | ONE Gas 2026 Proxy Statement | 48-50 |
| OTTR | Otter Tail Corp | 178.5%* | Otter Tail 2026 Proxy Statement | 38-41 |
| PEG | Public Service Enterprise Group Inc | 137.0% | PSEG 2026 Proxy Statement | 47-48 |
| PNW | Pinnacle West Capital Corp | 154.5% | Pinnacle West 2026 Proxy Statement | 62-67 |
| POR | Portland General Electric Co | 93.2% | Portland General Electric 2026 Proxy Statement | 49-55 |
| PPL | PPL Corp | 115.7%* | PPL Corporation 2026 Proxy Statement | 45-51 |
| SO | Southern Co | 179.0% | Southern Company 2026 Proxy Statement | 41-45 |
| SR | Spire Inc | 93.2%* | Spire Inc. 2025 Proxy Statement | 38-39 |
| SRE | Sempra | 172.8% | Sempra 2026 Proxy Statement | 45, 55-56 |
| SWX | Southwest Gas Holdings, Inc. | 141.0% | Southwest Gas Holdings 2026 Proxy Statement | 55-58 |
| TXNM | TXNM Energy Inc | 80.0% | TXNM Energy 2026 Proxy Statement | 46-48 |
| UGI | UGI Corp | 139.9% | UGI Corporation 2026 Proxy Statement | 43-45 |
| UTL | Unitil Corp | 137.0% | Unitil 2026 Proxy Statement | 52, 63 |
| WEC | WEC Energy Group, Inc. | 210.0% | WEC Energy Group 2026 Proxy Statement | 46-49 |
| WTRG | Essential Utilities, Inc. | 187.0%* | Essential Utilities 2026 Proxy Statement | 52-55 |
| XEL | Xcel Energy Inc | 143.8% | Xcel Energy 2026 Proxy Statement | 36 |
* Adjusted to remove individual-performance or discretionary components; remaining metrics rescaled to 100%.
Note on company counts: The sample covers 52 companies. Of these, 51 have a 2025 overall achievement figure (Hawaiian Electric’s 2025 incentive was deferred). The $253.8 million incentive total covers 50 companies: it excludes Enbridge, which reports in Canadian dollars, and Otter Tail, which is not in the compensation dataset. In the pay chart, “Other” is all other compensation plus change in pension value and nonqualified deferred compensation earnings.