
By Geoffrey Lubbock
When states began “restructuring” their electricity markets in the late 1990s and early 2000s, the pitch to consumers was straightforward: let power companies compete for your business, the way phone or insurance companies do, and prices will fall. Nearly three decades later, with fifteen years of granular state-level EIA data now easy to pull apart, it’s worth asking plainly: did it work?
Based on the numbers, the honest answer is not really — at least not for residential customers, and not in the way advocates promised. That doesn’t mean regulated monopoly utilities are some kind of consumer paradise either. But the specific claim that opening up retail electricity to competition would put downward pressure on household bills has not held up well, either in the EIA’s own state-by-state data or in the independent research that has tried to test it more rigorously.
What “deregulation” actually changed
A quick refresher, since the terminology gets used loosely. “Deregulating” or “restructuring” the electricity industry meant separating — unbundling — the business of generating power from the business of delivering it over the wires. The wires part (the poles, transformers, meters, and billing infrastructure) stayed a regulated monopoly almost everywhere, for the obvious reason that running two competing sets of power lines down every street would be absurd. What changed was the generation and supply side: instead of one utility handling everything for a flat, regulated rate, customers in restructured states could theoretically shop among competing suppliers for the electricity itself.
Roughly nineteen states plus Washington DC went down this road to varying degrees — Texas, Ohio, Pennsylvania, Illinois, and most of the Northeast corridor fall into this group, alongside a handful of states like California, Michigan, Oregon, and Nevada that restructured but then capped residential participation or walked it back after the early-2000s California energy crisis. The other thirty-two states never restructured at all; their utilities still generate, deliver, and bill for power as a single, rate-regulated package.
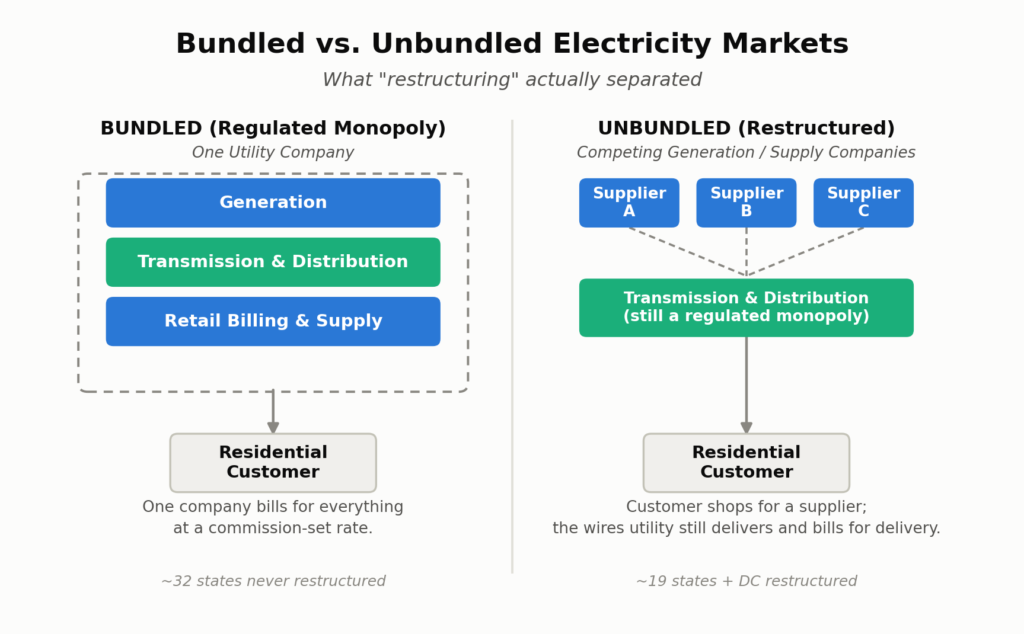
What “unbundling” separated: the wires stayed a regulated monopoly; generation and retail supply were opened to competition
The national picture: deregulated states have been more expensive every single year since 2010
Pulling residential price data for all fifty states plus DC from 2010 through 2024 and splitting them into these two groups produces a pattern that doesn’t move around much year to year — deregulated states have had a higher average residential price than regulated states in every one of the fifteen years in the dataset, and the gap has not been closing. If anything, it has been getting worse.
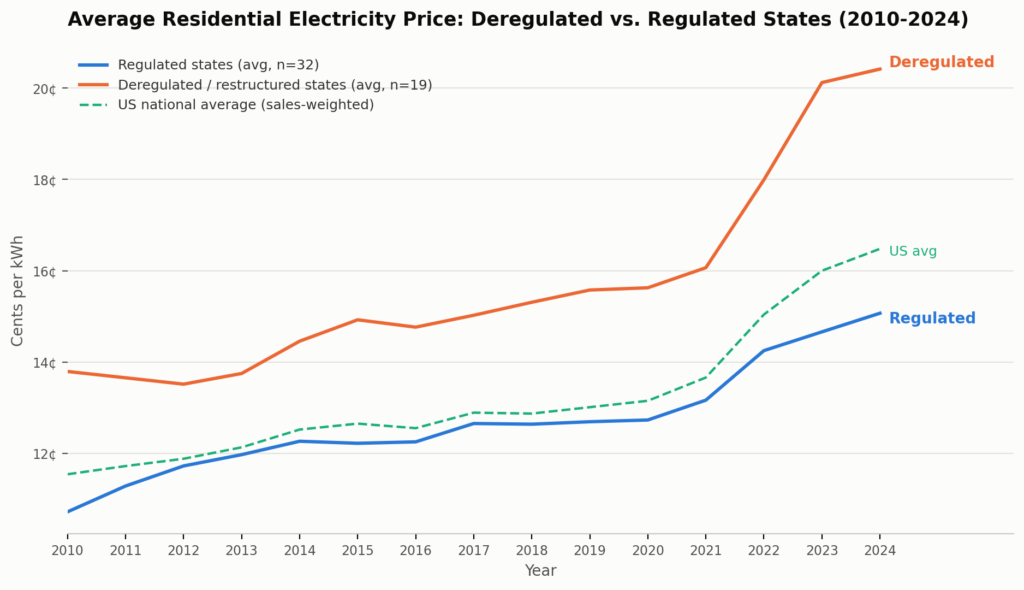
Average residential price, deregulated vs. regulated states, 2010–2024
In 2010, the average deregulated state charged residential customers about 13.8 cents per kWh against 10.7 cents in regulated states — a 29% premium. By 2024, deregulated states averaged 20.4 cents against 15.1 cents in regulated states, a 35% premium, after the gap briefly spiked above 37% in 2023. Both groups got more expensive over the period (electricity got more expensive everywhere, largely on the back of natural gas price swings and grid investment), but the deregulated group’s prices rose faster in raw cents-per-kWh terms than the regulated group’s did.
To be fair to the skeptics of this comparison: this is a correlation, not a controlled experiment. States didn’t restructure at random. The states that chose to deregulate in the 1990s were disproportionately dense, coastal, colder-winter, higher-cost-of-living places (the Northeast corridor, California, Illinois) that already had higher electricity costs before restructuring, for reasons that have nothing to do with market structure — land costs, labor costs, environmental compliance costs, and a heavier reliance on natural gas that gets expensive in cold snaps. A simple before-and-after or side-by-side comparison of state averages can’t fully separate “deregulation caused higher prices” from “places that already had higher prices were the ones that deregulated.” It’s the central methodological challenge every serious study in this space has had to wrestle with.
A cleaner test: what happens when you actually switch
Fortunately, there’s a more controlled comparison available inside the same EIA data, one that sidesteps the “different states have different costs” problem almost entirely: comparing customers within the same state who buy electricity from the traditional bundled utility (EIA calls this “Full-Service”) against customers in that same state who switched to a competitive supplier (“Competitive Service Providers”). Same state, same grid, same weather, same year, so the only difference is whether the household shopped around.
Across the sixteen states with genuine competitive-market activity and fifteen years of data — 239 state-year comparisons in total — customers who bought from a competitive supplier paid more than customers who stayed on the traditional utility’s bundled service in 83% of those comparisons, by an average of 1.65 cents per kWh. In California, Massachusetts, Maine, New York, and Pennsylvania, competitive-supplier customers paid more than the traditional utility’s customers in literally every single year on record. Only two states in the dataset — New Hampshire and Ohio — showed competitive customers coming out ahead more often than not, and even there it was closer to a coin flip than a clear win.
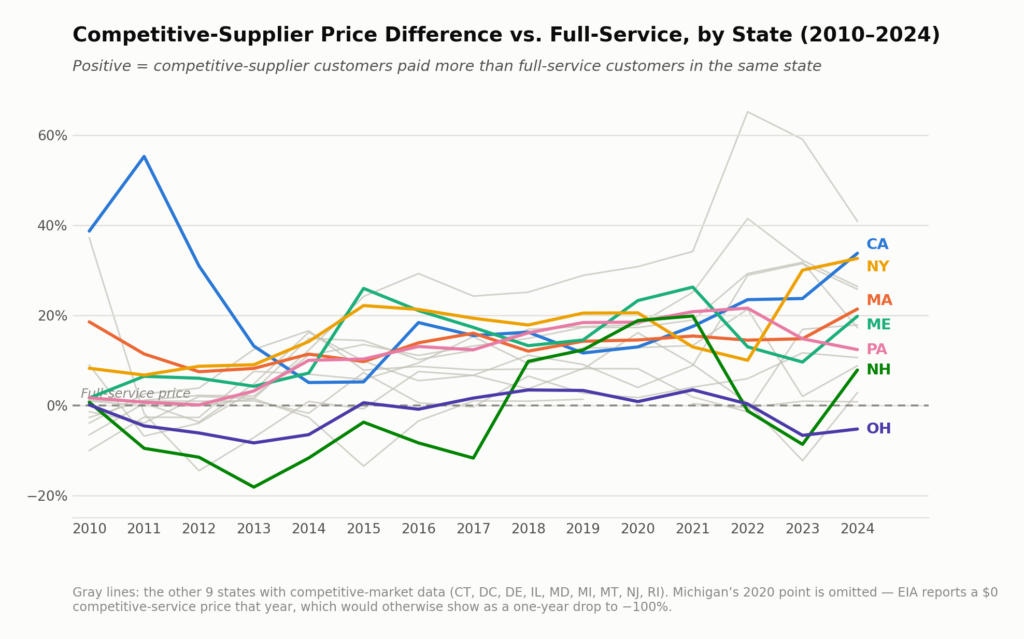
Competitive-supplier price difference vs. full-service, by state, 2010–2024 (positive = competitive supplier cost more)
This is about as close to a controlled comparison as this kind of data gets, and it points the same direction as the national one: shopping for a competitive electricity supplier has, more often than not, cost people money rather than saved it.
Independent research says the same thing, and offers a “why”
This isn’t just one dataset finding an odd pattern. The American Public Power Association has tracked this exact regulated-vs-deregulated gap since the late 1990s and reported, in its most recent update, that the original promise of reduced prices from deregulation has not materialized after more than two decades — their numbers showed deregulated states averaging 12.8 cents per kWh against 10 cents in regulated states as of 2021, with the gap having widened notably since 2012.
A 2026 Ohio State University study went further and looked at the actual mechanics of why. Researchers compiled a decade of daily retail-choice offers filed by every licensed supplier in Ohio and found that 72% of open-market offers were priced above the utility’s own default regulated rate — the rate you’d pay by doing nothing at all. The same research linked the size of that gap directly to auction competition: utility default-service auctions with more bidders produced meaningfully lower default rates (a handful of extra bidders was worth double-digit percentage savings), suggesting the theoretical benefits of competition are real but were being captured mostly at the wholesale auction level, not passed through to shoppers navigating the retail market.
An academic study of the broader restructuring era (covering 2000–2016, cited by MIT’s Climate Portal) found a similar split personality in the data: deregulation did modestly reduce underlying generation costs, exactly as the textbook competitive-markets story predicts. But markups — the gap between what it cost to generate power and what was actually charged — rose even more, driven overwhelmingly by increased market power in wholesale generation markets rather than at the retail level. Net effect: prices about 19% higher than they would have been without restructuring. The efficiency gains were real; they were just outweighed by pricing power that flowed to sellers, not savings that flowed to customers.
A firsthand case study: stranded costs, PURPA buyouts, and the Boston Edison divestiture
Some of the clearest evidence of how this actually played out comes from the restructuring negotiations themselves, not just from the price data left behind afterward. I was directly responsible for negotiating one of these deals: Boston Edison’s divestiture of its generating plants as part of Massachusetts’s electricity restructuring in the late 1990s. The mechanics of that negotiation, and the reasons the utility agreed to it, help explain both why restructuring happened when it did and why the savings it produced didn’t always show up cleanly on a residential customer’s bill.
Under the settlement, Boston Edison agreed to sell its power plants — a step Massachusetts, like most restructuring states, required as a condition of opening the market, on the theory that a utility that also owned generation had every incentive to favor its own plants over cheaper competitors. The plants sold for less than their undepreciated book value, the amount still on the utility’s books that ratepayers hadn’t yet finished paying off through depreciation. That shortfall became a stranded cost, and the agreement with the Massachusetts Department of Public Utilities was that the utility would be allowed to recover it from customers, typically through a dedicated transition charge added to bills for a period of years.
Two forces made this trade attractive to the utility rather than something it had to be forced into. The first was competitive pressure from non-utility generators, who by the 1990s could build new gas-fired plants at a fraction of the going-forward cost of operating the utility’s older, higher-book-value plants. Some of these non-utility generators weren’t just competing at the wholesale level — they were approaching the utility’s own large industrial and commercial customers directly, offering to build dedicated power plants for them. Every large customer that left for one of those arrangements would have taken its share of the bill for the utility’s existing plants with it, leaving the remaining stranded costs to be spread across a smaller base of remaining customers. Locking in stranded-cost recovery through a negotiated settlement, before that erosion happened, was a better outcome for the utility than risking being left holding the bag.
The second force was the PURPA overhang. Utilities across the country, including Boston Edison, were locked into long-term “must-buy” contracts with qualifying facilities under PURPA’s mandatory-purchase provisions, many signed years earlier at avoided-cost rates that assumed continued high oil and gas prices. By the 1990s, natural gas prices had fallen and new gas turbine technology had gotten dramatically more efficient, so a lot of that contracted power was both more than the utility actually needed and priced well above what the same power would cost on the open market. Buying out of those contracts, even at real cost, was often cheaper than honoring them. In one negotiation I handled directly, Boston Edison paid the developer Altresco a $10 million lump sum to be released from a power purchase contract that would otherwise have cost the utility roughly $100 million more than market price over its remaining term — a ten-to-one trade that illustrates just how far some of the 1980s-era PURPA contracts had drifted from market reality by the time restructuring arrived.
Taken together, PURPA’s forced opening of the generation market to independent producers, combined with the arrival of far cheaper new gas turbine technology, did significantly lower the underlying cost of building and running generation, compared with a counterfactual where vertically integrated utilities kept building and operating plants the old way. That is the same effect the Ohio State and MIT-cited research pick up on the wholesale side. But from a residential customer’s perspective, those savings did not arrive for free: the transition required writing off the gap between old book values and new market prices, and that gap — the stranded cost — landed on customer bills as a separate charge for years afterward, on top of whatever price the customer ended up paying for supply itself. The generation-cost savings were real. Whether they netted out to savings for the customer paying both a stranded-cost charge and a market supply price depended heavily on the specifics of each state’s settlement and each customer’s circumstances — which is exactly the kind of state-by-state variation the aggregate price data above can’t fully untangle.
The case for the other side
It would be unfair to leave it there without describing what defenders of retail choice actually argue, because the debate isn’t completely one-sided in principle, even if the price data leans hard one way.
The Retail Energy Supply Association’s core argument is less about documented savings and more about incentives: a regulated monopoly, they argue, has little incentive to cut costs once its rates are locked in by a commission, while competitive suppliers have to keep innovating on pricing, service, and product design — green power blends, fixed-rate products, demand-response programs — or lose customers. Notably, when you look closely at their public materials, they don’t lean heavily on specific savings percentages or head-to-head price data — the case is built more on market theory than on empirical outcomes, which is telling given how much price data exists either way.
R Street Institute’s state-by-state competition scorecard takes a more market-design-focused view: competition works better where states paired retail choice with real supporting infrastructure — smart-meter data access, consolidated billing, clear consumer education, and minimal price caps — and it consistently points to Texas as the strongest example of the model working as intended (it’s one of very few states to earn close to a top grade). Texas is a useful data point precisely because it’s structured differently from the Northeast-style choice markets in this analysis: nearly the entire state runs on competitive retail electric providers, and in EIA’s own reporting, essentially all of that gets classified as “Full-Service” rather than split out into a separate competitive category the way it is in states like Illinois or Massachusetts. That’s a genuine limitation of doing this analysis with EIA’s category labels — Texas’s competitive market doesn’t show up as “competitive” in this particular breakdown, so it isn’t part of the 83%-paid-more figure above, and it’s worth being upfront that Texas may be a better-functioning example of retail choice than this dataset can directly speak to.
So, did it work?
For the specific promise made to residential customers — that letting suppliers compete for your business would push your electric bill down — the weight of evidence, both in this EIA dataset and in the independent research it lines up with, says no. Deregulated states have cost more than regulated ones in every year measured since 2010, the gap has widened rather than narrowed, and customers within those same deregulated states who actually went out and shopped for a competitive supplier paid more than their neighbors who didn’t, more than four times out of five.
The theoretical case for competition — that it should reward efficiency and punish waste — isn’t wrong on its own terms. The research suggests real efficiency gains did show up on the generation side, and the Boston Edison case study above shows exactly how: PURPA forced the door open to independent generators, and once cheap new gas turbine technology arrived, it became cheaper to buy out old above-market obligations and retire old plants than to keep running them. But those generation-side savings were consumed in two places before they could reach a residential bill — by increased pricing power upstream in wholesale and retail markets, and by the stranded-cost transition charges that paid for writing off the old plants in the first place. Per the Ohio findings, seven in ten competitive offers were also priced above the rate customers could have gotten by doing nothing. Where the model seems to work better — Texas being the most-cited example — it’s associated with specific market-design choices (deep competition among suppliers, strong consumer information tools, minimal carve-outs) rather than restructuring alone. The lesson isn’t that markets can’t work for electricity; it’s that the underlying cost savings were genuine, but simply opening the door to competition, without also solving for market power, transition costs, and the information gap between suppliers and shopping households, hasn’t been enough to reliably deliver those savings to the customer.
Data sources: U.S. Energy Information Administration, “Electric Sales, Revenue, and Average Price” (Full-Service Providers, Total Electric Industry, and Competitive Service Providers tables, residential sector, 2010–2024); American Public Power Association, “Retail Electric Rates in Regulated and Deregulated States”; Ohio State University retail electricity choice research (2026); MIT Climate Portal summary of academic research on deregulation, market power, and prices; Retail Energy Supply Association; R Street Institute State-by-State Scorecard on Electricity Competition.