
Commercial and Industrial Buyers Tell a Very Different Story from Residential Customers
By Geoffrey Lubbock
My previous blog showed that residential customers did not appear to benefit from electricity deregulation. Households that shopped for a competitive supplier paid more than households that stayed on the traditional utility’s bundled service in 83% of state-year comparisons since 2010, by an average of 1.65 cents per kWh. But residential customers are only one part of the market. In most of the states that opened their markets, such as Massachusetts, Pennsylvania and Ohio, residential, commercial and industrial customers all became eligible to choose a supplier at the same time. A few states, including Nevada, Oregon, Virginia and Washington, only ever opened the market to larger nonresidential customers. Even where everyone could choose, the larger, more sophisticated customers were much quicker to take it up, and they buy on a completely different scale. Does the competitive market treat them the same way it treats homeowners?
Pulling the same EIA data for the commercial and industrial sectors gives a clear answer: no, not even close. Bigger customers moved faster, unbundled further, and more often than not actually saved money doing it.
Big customers were quick to act
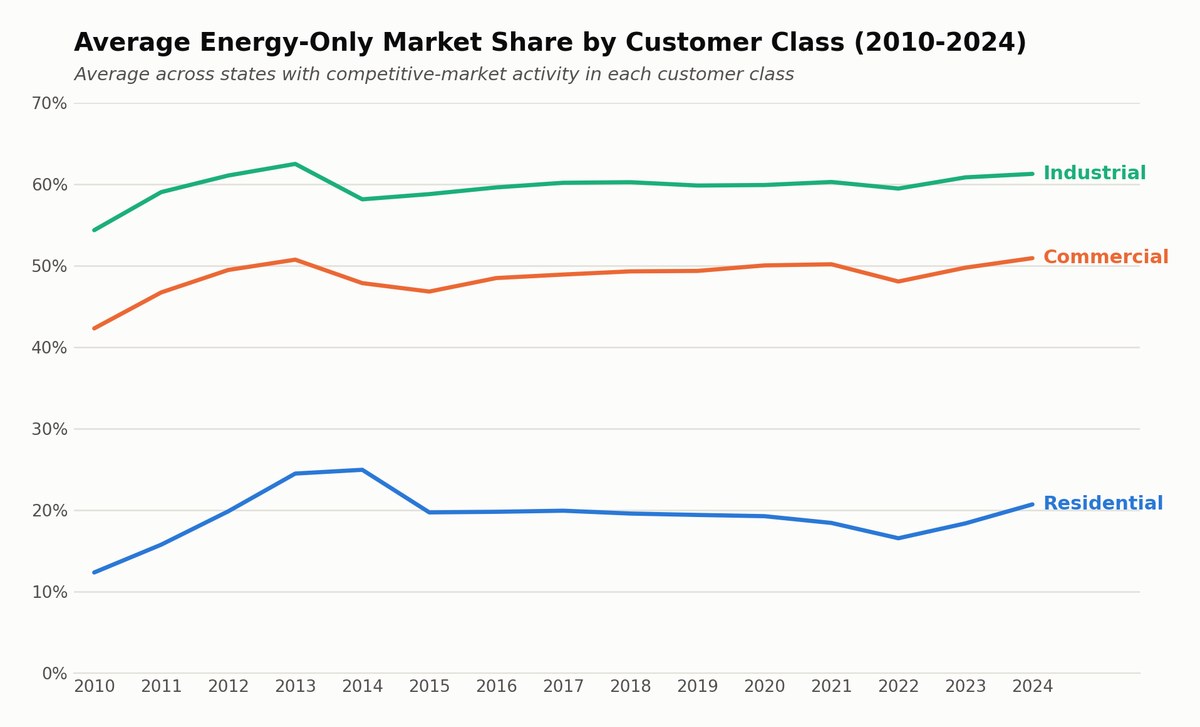
There are big differences between the three customer classes in how much of their energy they buy from the competitive market. I compared the megawatt-hours purchased from competitive “Energy-Only” suppliers with the total sold in each state, and averaged that percentage each year across every state with retail choice. Residential unbundling increased slowly, from about 12% of sales in 2010 to roughly 21% in 2024, with some dips in between. Commercial and industrial customers started the period already far more unbundled than residential customers are today. Commercial averaged 42% in 2010 and reached 51% by 2024; industrial started at 54% in 2010 and reached 61% by 2024. My conclusion is that larger users spent more time understanding their costs and made their decisions on a clear economic basis. Many residential customers were used to a utility regulated by their state, and so trusted it to charge a fair price.
This lines up with my previous blog. In the late 1970s the cost of new gas generators was dropping significantly, and in 1978 PURPA introduced the requirement that utilities buy power from Qualifying Facilities (QFs) at the utility’s “avoided cost.” At the time, new competitive generation cost about two-thirds as much as a utility-built plant, partly because a utility would get a quote on a generator and then have its in-house engineers modify the design during construction. Most QFs were put together differently. A marketing company such as Enron would get a fixed-price quote from an engineering firm to build a generator to a set specification, with a payment clause stating that the builder would be paid only when the generator was fully operational. The specification was never changed. The marketer would then bid on, or offer, a contract to a utility for the life of the generator. Once it had the contract, it borrowed against it so it did not need to finance the plant itself, and after the deal closed it sold the operation to a third party. Basically, these operators lowered the cost of generation by sticking rigidly to the specification and by securing contracts they could borrow against and resell.
Independent power suppliers in that same era were also approaching large commercial and industrial customers directly, offering to bypass the utility’s delivery system altogether by building a dedicated power plant on-site. This happened with Boston-area hospitals (none of which took the offers) and with large auto manufacturers in other states, and something similar is reportedly under discussion today with large AI data centers.
Because commercial and industrial customers were aware of the potential savings even before the deregulated market opened, they were much quicker to buy competitive power. Residential retail choice never came close to the same level. The market share data shows the gap never really closed: commercial and industrial customers have been roughly two to three times more unbundled than residential customers throughout 2010-2024.
State by state, the gap is even more dramatic. In the most unbundled commercial markets (Washington DC, Ohio and Massachusetts), competitive suppliers accounted for 81-84% of commercial sales by 2024. For industrial customers, DC’s full-service segment has disappeared entirely (100% competitive), and Pennsylvania and New Hampshire both exceed 90%. No residential market comes close. Even Ohio, the most unbundled residential state in this dataset, tops out at 57%.
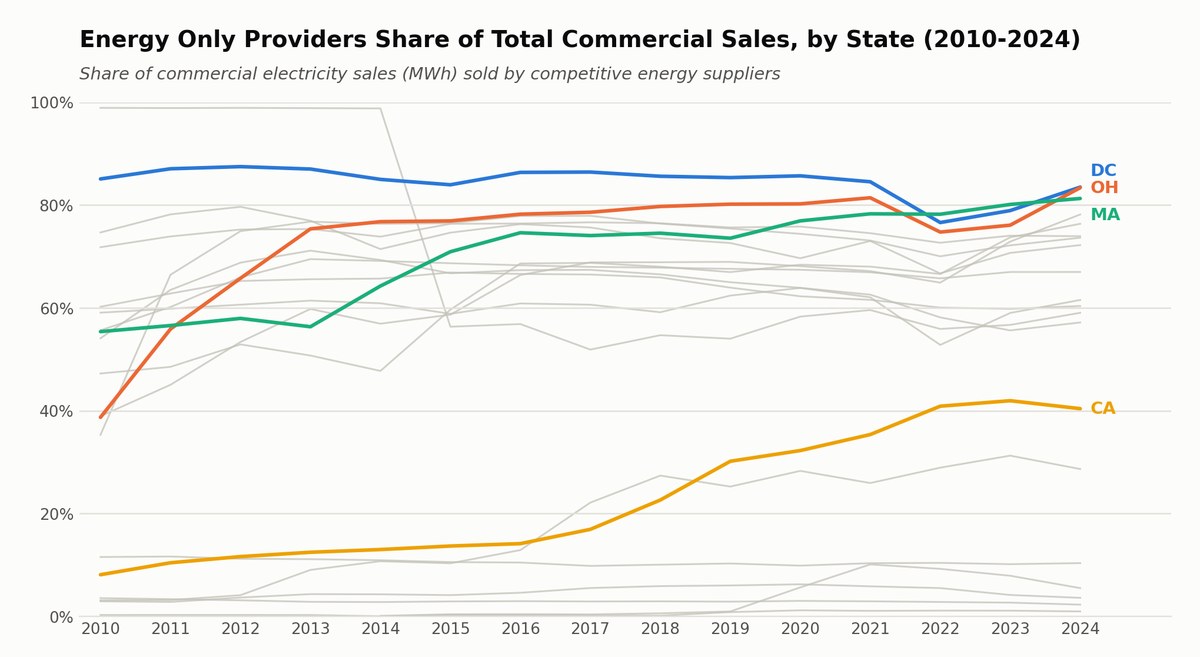
Gray lines: the other 16 states with competitive-market data (CT, DE, IL, MD, ME, MI, MT, NH, NJ, NV, NY, OR, PA, RI, VA, WA).
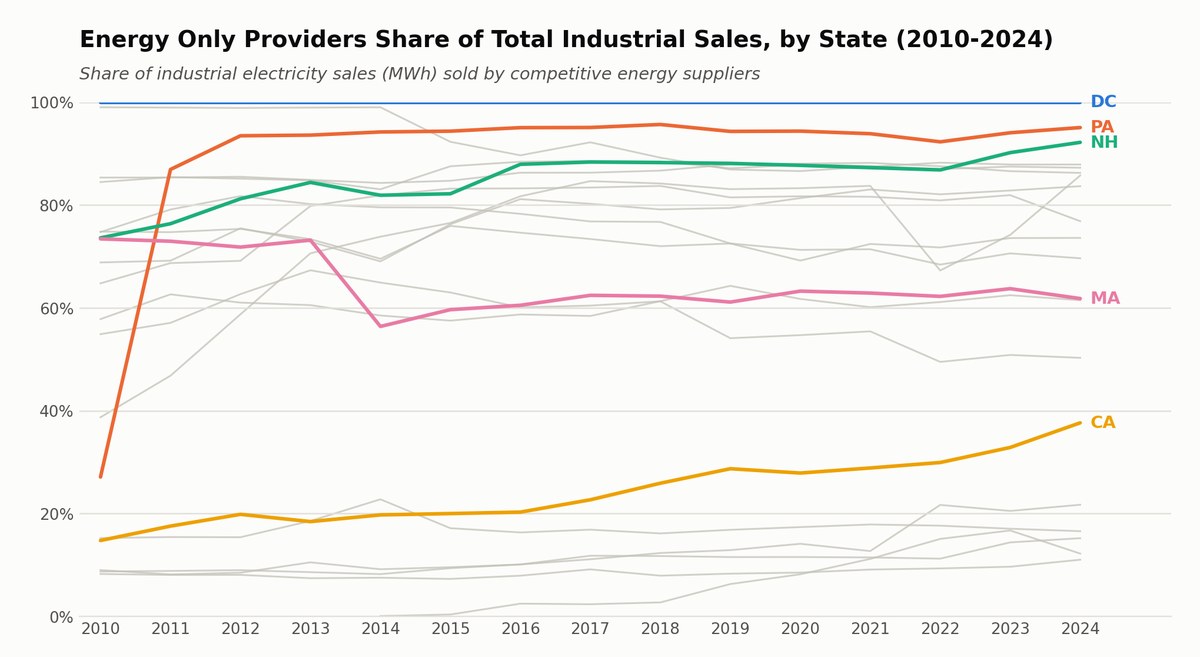
Gray lines: the other 15 states with competitive-market data (CT, DE, IL, MD, ME, MI, MT, NJ, NV, NY, OH, OR, RI, VA, WA).
And unlike residential, big customers saved money
Whereas the previous blog showed residential customers paying more in the competitive market, commercial and industrial customers paid less. Commercial customers on a competitive supplier paid less than full-service customers in 87% of 296 state-year comparisons, by an average of 1.88 cents per kWh. Industrial customers paid less in 69% of 281 comparisons, by an average of 1.03 cents per kWh. That is close to a mirror image of the residential result, where competitive customers paid more 83% of the time.
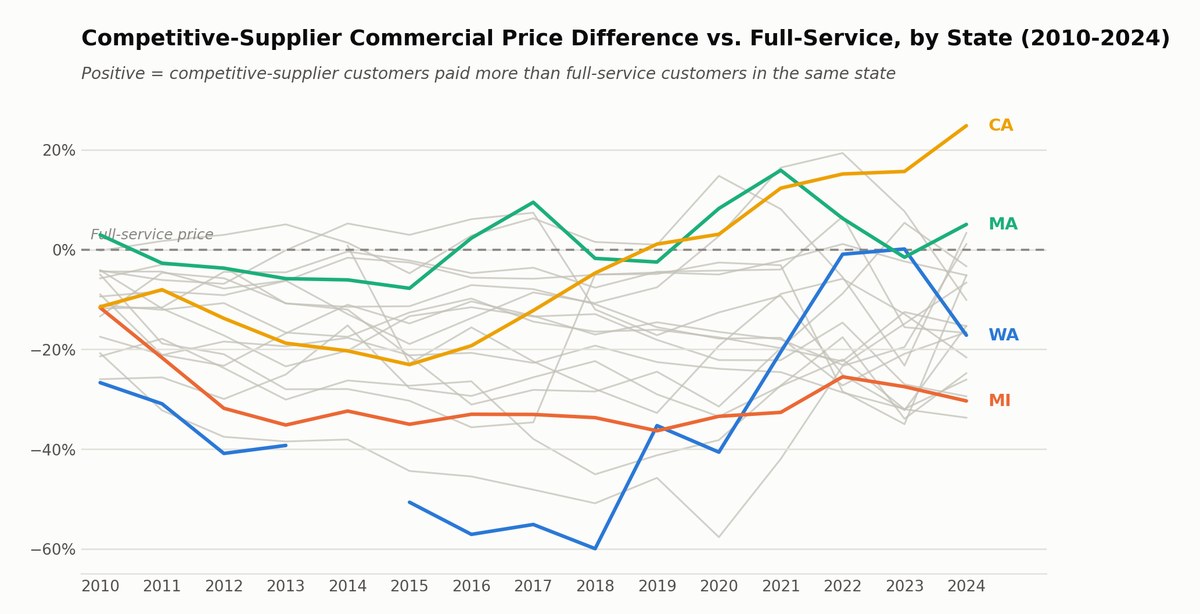
Gray lines: the other 16 states with competitive-market data (CT, DC, DE, IL, MD, ME, MT, NH, NJ, NV, NY, OH, OR, PA, RI, VA). Washington 2014 is left as a gap because EIA reports a $0 competitive-service price that year.
Nevada and Washington stand out as some of the largest and most persistent savers in this dataset. Competitive commercial and industrial customers in both states have often paid 40-60% less than their full-service counterparts in the same state, year after year. Michigan’s commercial customers and Montana’s industrial customers show a similar, steadier pattern of real savings.
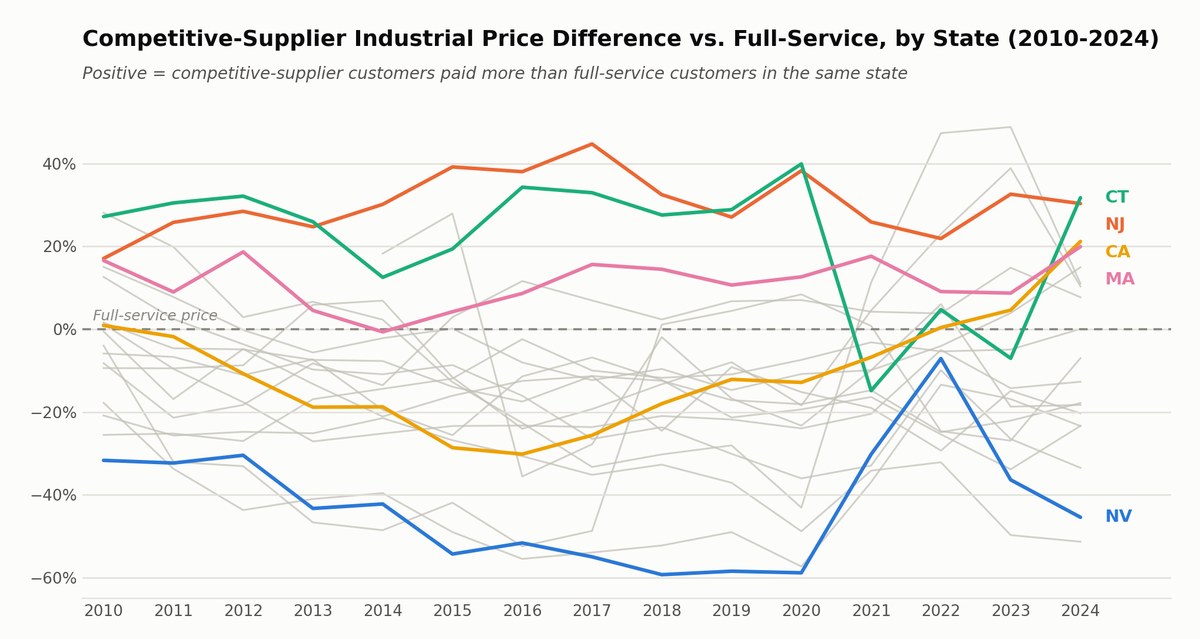
Gray lines: the other 14 states with competitive-market data (DE, IL, MD, ME, MI, MT, NH, NY, OH, OR, PA, RI, VA, WA).
The picture is not all rosy, though, and there are exceptions. New Jersey and Connecticut industrial customers have paid a competitive-market premium in most years, often 25-45% above the full-service price. In those two states at least, buying unbundled power has been consistently expensive for industrial customers rather than a money-saver. Massachusetts industrial customers sit in between, with a smaller but fairly consistent premium, typically 5-20% in most years. California is a cautionary case of its own. Both its commercial and industrial competitive prices have drifted from savings toward a premium over the past decade, moving from roughly break-even or a modest discount around 2010-2015 to a 20-25% premium by 2024. That is the same direction, if not quite the same scale, as the pattern my previous blog found for California’s residential customers.
Why the story is different for big customers
This connects directly back to the stranded-cost case study in my earlier blog. When PURPA forced open the generation market and new gas-turbine technology made non-utility generation cheap, the first customers the independent generators went after were the ones with enough load to make a dedicated deal worth negotiating: large industrial plants and big commercial accounts, not individual households. Even where every customer class could choose a supplier from the same day, that early uptake by the larger customers grew over the decades into the wide unbundling gap shown in the market-share charts above.
Size also brings expertise. A large industrial customer can afford (or already employs) an energy manager or outside procurement consultant who negotiates directly with suppliers on real-time or block-and-index pricing, instead of picking from a menu of flat-rate retail offers that are designed to be easy to sell rather than easy to compare. The Ohio State University research cited in my earlier blog found that 72% of competitive residential offers in Ohio were priced above the utility’s default rate, a gap that persists because most residential shoppers cannot easily tell a good offer from a bad one. That information gap does not exist to the same degree for a factory or a shopping mall buying power through a broker who does this full time.
In other words, retail competition appears to work reasonably well when the buyer has the size and expertise to act as a sophisticated market participant, and considerably less well, or even backfires, when the buyer is a household comparing flyers in the mail. The New Jersey and Connecticut industrial results, and California’s drift toward a premium across all three customer classes, are reminders that even sophisticated buyers are not immune to poor markets. But in this dataset they remain the exception rather than the rule.
What this means for the deregulation debate
Put the two blogs together and you get a more complete picture of electricity restructuring than either one gives alone. The theoretical case for competition, that it rewards efficient suppliers and gives buyers leverage, was not wrong. It was just unevenly realized. Commercial and industrial customers, who moved first when the markets opened and shop with real market power and expertise, have captured savings in a clear majority of cases. Residential customers, who were slower to switch, switched less and largely without professional help, have more often ended up paying a premium for the privilege of choosing. The promise made to households in the late 1990s and early 2000s was not that “the customers with the best negotiating leverage will benefit.” It was that competition would lower everyone’s bill. For households, that promise has not been kept.
Data source: U.S. Energy Information Administration, Form EIA-861, “Annual Sales to Ultimate Customers by State and Sector, 2010-2024” (HS861 2010-.xlsx; Total Electric Industry, Full-Service Providers, Energy-Only Providers and Delivery-Only Providers tabs, commercial and industrial sectors), available at https://www.eia.gov/electricity/data/state/xls/861/HS861%202010-.xlsx.
EIA had not published the 2025 annual data as of 9/29/2026.
Appendix: Energy-Only Providers’ Share of Total Sales, by State (2010, 2015, 2020 and 2024)
Commercial Sector
| State | 2010 | 2015 | 2020 | 2024 |
|---|---|---|---|---|
| CA | 8% | 14% | 32% | 40% |
| CT | 75% | 75% | 70% | 72% |
| DC | 85% | 84% | 86% | 83% |
| DE | 59% | 59% | 64% | 62% |
| IL | 56% | 69% | 67% | 67% |
| MA | 55% | 71% | 77% | 81% |
| MD | 72% | 76% | 76% | 74% |
| ME | 99% | 56% | 58% | 59% |
| MI | 12% | 11% | 10% | 10% |
| MT | 4% | 3% | 3% | 2% |
| NH | 39% | 59% | 68% | 78% |
| NJ | 54% | 67% | 64% | 57% |
| NV | 3% | 10% | 28% | 29% |
| NY | 60% | 67% | 62% | 60% |
| OH | 39% | 77% | 80% | 83% |
| OR | 3% | 4% | 6% | 4% |
| PA | 35% | 76% | 74% | 74% |
| RI | 47% | 60% | 68% | 76% |
| VA | — | 0% | 6% | 5% |
| WA | 0% | 0% | 1% | 1% |
Industrial Sector
| State | 2010 | 2015 | 2020 | 2024 |
|---|---|---|---|---|
| CA | 15% | 20% | 28% | 38% |
| CT | 75% | 76% | 69% | 74% |
| DC | 100% | 100% | 100% | 100% |
| DE | 55% | 63% | 55% | 50% |
| IL | 85% | 85% | 88% | 86% |
| MA | 73% | 60% | 63% | 62% |
| MD | 84% | 88% | 88% | 87% |
| ME | 99% | 92% | 87% | 88% |
| MI | 15% | 17% | 17% | 17% |
| MT | 58% | 58% | 62% | 61% |
| NH | 74% | 82% | 88% | 92% |
| NJ | 75% | 80% | 71% | 70% |
| NV | 9% | 9% | 14% | 22% |
| NY | 65% | 83% | 82% | 77% |
| OH | 39% | 77% | 83% | 86% |
| OR | 9% | 10% | 12% | 15% |
| PA | 27% | 94% | 94% | 95% |
| RI | 69% | 76% | 81% | 84% |
| VA | — | 0% | 8% | 12% |
| WA | 8% | 7% | 8% | 11% |
Source: U.S. Energy Information Administration, Form EIA-861, “Annual Sales to Ultimate Customers by State and Sector, 2010-2024” (HS861 2010-.xlsx), Energy-Only Providers and Total Electric Industry tabs, commercial and industrial megawatt-hour sales, 2010-2024. U.S. total excluded; states with no Energy-Only Providers sales in any year omitted. EIA had not published the 2025 annual data as of 9/29/2026.
Appendix: Competitive-Supplier Price Premium vs. Full-Service, by State
Each figure is the competitive-supplier price divided by the full-service price in the same state and year, minus one. Red (positive) means customers of competitive suppliers paid more; green (negative) means they paid less. n/a means there was no comparison that year.
Residential Sector
| State | 2010 | 2015 | 2020 | 2024 |
|---|---|---|---|---|
| CA | +39% | +5% | +13% | +34% |
| CT | −4% | +8% | +16% | +3% |
| DC | −1% | +24% | +31% | +41% |
| DE | +9% | +14% | +18% | +26% |
| IL | +37% | −1% | +8% | +18% |
| MA | +19% | +10% | +14% | +21% |
| MD | −3% | +13% | +17% | +17% |
| ME | +2% | +26% | +23% | +20% |
| MI | +1% | −14% | n/a | +1% |
| MT | +1% | +7% | +2% | +11% |
| NH | +1% | −4% | +19% | +8% |
| NJ | −7% | +10% | +4% | +26% |
| NY | +8% | +22% | +21% | +33% |
| OH | 0% | +1% | +1% | −5% |
| PA | +2% | +10% | +18% | +12% |
| RI | −10% | +6% | +13% | +9% |
Commercial Sector
| State | 2010 | 2015 | 2020 | 2024 |
|---|---|---|---|---|
| CA | −11% | −23% | +3% | +25% |
| CT | 0% | −5% | +15% | +3% |
| DC | −12% | −2% | −4% | −17% |
| DE | −26% | −28% | −33% | −34% |
| IL | −17% | −15% | −17% | −7% |
| MA | +3% | −8% | +8% | +5% |
| MD | −6% | −11% | −18% | −17% |
| ME | −4% | +3% | −13% | −15% |
| MI | −12% | −35% | −33% | −30% |
| MT | −21% | −44% | −58% | +1% |
| NH | −5% | −30% | −3% | −5% |
| NJ | −9% | −3% | −5% | −5% |
| NV | −21% | −27% | −38% | −25% |
| NY | −11% | −13% | −18% | −15% |
| OH | −4% | −13% | −22% | −29% |
| OR | −13% | −21% | −31% | −3% |
| PA | −9% | −21% | −24% | −26% |
| RI | −4% | −19% | +3% | −10% |
| VA | n/a | −23% | −19% | −22% |
| WA | −27% | −51% | −41% | −17% |
Industrial Sector
| State | 2010 | 2015 | 2020 | 2024 |
|---|---|---|---|---|
| CA | +1% | −29% | −13% | +21% |
| CT | +27% | +19% | +40% | +32% |
| DE | −21% | −27% | −49% | −51% |
| IL | +15% | 0% | −11% | +15% |
| MA | +17% | +4% | +13% | +20% |
| MD | +2% | −14% | −18% | −18% |
| ME | −26% | −12% | −7% | 0% |
| MI | +1% | −23% | −24% | −13% |
| MT | −18% | −49% | −57% | −23% |
| NH | −4% | −42% | +8% | −7% |
| NJ | +17% | +39% | +38% | +30% |
| NV | −32% | −54% | −59% | −45% |
| NY | −8% | +3% | +7% | +8% |
| OH | +13% | −9% | −36% | −33% |
| OR | −9% | −12% | −18% | +10% |
| PA | −1% | −16% | −15% | −20% |
| RI | −6% | −26% | −19% | −23% |
| VA | n/a | +28% | −23% | −18% |
| WA | +28% | −13% | −43% | +11% |
Source: U.S. Energy Information Administration, Form EIA-861, “Annual Sales to Ultimate Customers by State and Sector, 2010-2024” (HS861 2010-.xlsx), Full-Service Providers and Competitive Service Providers tabs, average price (cents/kWh) by sector. U.S. total excluded; 2024 is the latest year published.